Take away their common language and destroy a great team. Wikipedia image
In the biblical story about the Tower of Babel, God wanted to prevent Man from building a tower that reached into the heavens. Construction of the tower was going along very well as everyone was working efficiently toward their common goal of reaching into the sky. Now I'm sure God could have just sent a storm to knock down the semi completed tower… but then Man would have simply started over. So instead he wrecked their construction team by causing everyone to speak a different language. Confusion was rampant since no one understood what the other's were saying. Construction halted and the team disbanded. Problem solved.
The recent survey we conducted included a number of questions about Teaching with Power – to get some understanding of “how's it going?” and the impact power has on your classes.
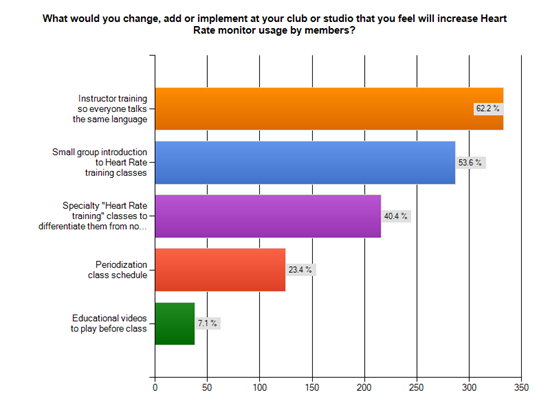
I see Instructors as bright people, who understand the root of many of the problems they encounter in class. So I asked the question:
Back during the Spring of 2011 we surveyed Instructors, asking the exact same questions – only about Heart Rate training. Unsurprisingly we got similar results.
So what can you do?
First you need to decide; “how much do I care about this issue?” Are you content to ignore it? Or are you someone who sees a problem and then looks for a way to solve it?
At the risk of sounding simplistic, all you need to do is create a common language between you and the other members of your Instructor team. Easier said than done, but don't make it too complicated.
And don't wait for Management – or expect them effectively solve this even if your Dept Head is 100% committed to the cause. Anything imposed on you and your team, without the voluntary buy-in from each team member, is guaranteed to fail. If you're in a Big Box and have experienced multiple new branded class formats, you know exactly what I'm talking about. Two weeks after the “big change”, everyone is back to their old style of teaching 🙁
My suggestion is to discuss this amongst yourselves. You could lead off by asking the question in an email with the intent to find a few other Instructors who see the problem:
Hi Team,
Do you feel like I do… that our class communication would be improved if we all spoke the same language around; Heart Rate and/or Power – Watts?
And then see what happens. Nobody wants to be forced into changing – but a few maybe willing to hear more from you. If you find some like-minded Instructors try to get them together – you might even offer to buy coffee. Present a simple solution; “my vote is we agree to only use 3/4/5 HR or Power Zones.” Just pick a number that everyone will agree on. Then discuss how do you decide the actual personal numbers that form the zones; Metabolic testing, Threshold tests, etc… Again you're looking for agreement, not who's right.
Image from http://adkjerseygirl.wordpress.com/2012/05/01/what-is-going-raw/
By Joan Kent
I’m often asked for my opinion about raw food diets, so I've done some research on them. Here’s what I think.
On the surface, it seems reasonable that raw foods would be better for us. After all, every process we put our food through, from start to finish, detracts at least a little from the nutrition. Raw foods would undergo the least processing, so they’d be more nutritious. Perhaps because of that, many raw foodies say they feel more energetic on a raw diet.
A couple of problems may occur with raw diets, though. One has to do with substances called goitrogens that some foods contain. These goitrogens can interfere with thyroid function, making it wise to limit or even avoid foods that contain them.
So which foods contain goitrogens? The list includes cabbage, peanuts, pine nuts, broccoli, Brussels sprouts, kale, spinach, bok choy, cauliflower, soy, mustard greens, collards, radishes, turnips, and more. As you know, some of these foods have a well-deserved reputation for being nutrition-packed all-stars, so we don’t necessarily want to eliminate them.
The good news is that heat from cooking can effectively destroy goitrogens, so these very healthful foods can still be part of your diet — as long as you let go of the raw rule where they’re concerned. I was in the habit of juicing several of these raw foods and stopped when I learned this information. Now I always steam or saute them. In the case of soy, fermentation (miso, tempeh) will do the trick.
Another problem I’ve seen has to do with which “track” the individual chooses. It actually appears to be quite clear-cut: Some raw foodies go in the vegetable direction, some in the fruit direction. It’s the fruit direction that concerns me. Fructose, the sugar in fruit, is nasty stuff.
Health-wise, fructose can induce insulin resistance, decrease glucose tolerance (both may lead to diabetes); increase blood pressure; increase LDL (bad) cholesterol or make it smaller, denser and more likely to form arterial plaque; raise triglycerides and risk for heart disease; rapidly convert to body fat; increase clotting; interfere with copper absorption, which is necessary for hemoglobin; and cause cavities. It doesn’t stimulate leptin and or suppress ghrelin, leading to increased appetite. It’s addictive, may stimulate sugar cravings, and can cause malabsorption and gastro-intestinal disturbances.
Fructose is also a relatively ineffective training fuel, either pre- or post-training. It absorbs less rapidly than glucose during exercise, promotes less water uptake, leading to dehydration, blocks sodium absorption, and replaces glycogen poorly.
Raw foodies who favor fruit tell me how great it is to “eat raw” because they “can have pie for breakfast”, and it’s perfectly fine because it’s raw. The pie shell is typically made from crumbled nuts, while the pie filling is fruit puree. Variations on this theme can be found in stores. Whole Foods, for example, sells cookies resembling Oreos, with a cookie made of crumbled nuts and filled with a paste-like fruit puree.
The advantages of raw food diets would seem to lie in the consumption of lots of vegetables, as well as the elimination of many unwholesome foods. Someone who goes from eating lots of bread, cakes, desserts, and other sugar- or gluten-containing foods to eating plenty of raw vegetables will undoubtedly experience a noticeable shift in health, weight, energy, and symptom management.
But if you’ve already made healthful changes in your diet and don’t eat much junk of any kind, you’ll probably notice a less dramatic change when switching to raw foods. Even a subtle change may feel worth it to you, however, so make your own decision.
If you decide to switch to a raw diet, please do yourself a big health favor and lean toward adding more vegetables to your meals, rather than fruit. My suggestions here are simple: Cook any foods that contain goitrogens, and get on the raw vegetable track, rather than the fruit track.
Fructose is sugar, no mistake. And in quantity, fruit and fructose can pack quite a mean punch. The fact that they’re raw won’t change that.
A different approach with a professional researcher still produced mixed results
Let’s start with the good news. I’m sorry, I was completely pulling your leg. I really don’t have any good news. I know, that’s terrible — you can throw pencils and small farm animals at me next time you see me. I was really looking for the good news in these results and I just can’t find any. This last series of retesting the same three bikes to see if we could garner the same or similar results each time we measure the bike has led to 2 out of the 3 bikes demonstrating a “skewed distribution” of data. In other words, data that you could not and should not try to predict with because they are in a word, unreliable. That means my hope for creating a “handicap” for each bike to render them even and fair for comparisons and competitions is not possible.
Statistical measurements often use Standard Deviation to determine how much variation there is in the individual readings or occurrences of data (in our cases — the differences between the actual power and the measured power). There is something called the “Emperical Rule” (http://www.pmean.com/08/SdTooBig.html) “…it says that approximately 95% of the data lies between plus and minus two standard deviations of the mean.” This 95% rule is for data with a “normal distribution”. This is what we were hoping for when we measured the same bike several times.
Please remember, this stage of the research was RE-measuring the same bikes, not measuring the differences in power between bike computer and actual power of the power pedals. We knew all along the pure accuracy would not be there, we were simply hoping that the amount or degree to which it was “off” would be consistent.
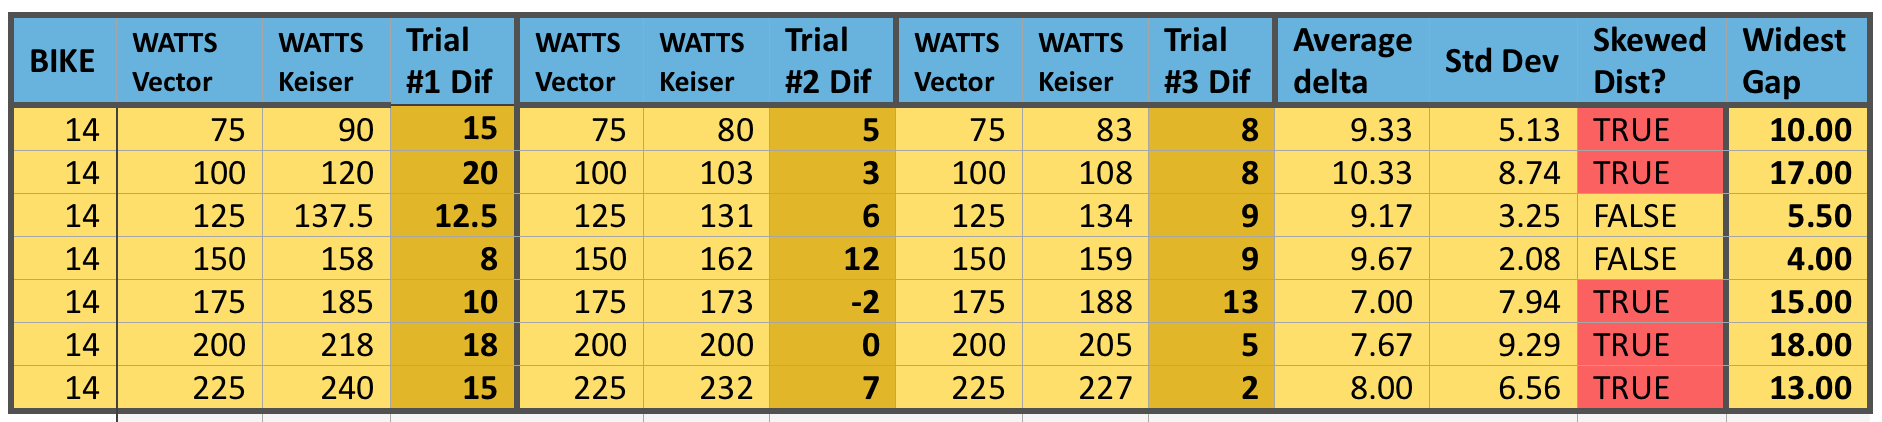
So getting back to our “Empirical Rule”. There is a corollary to that principle, and that is “If a non-negative set of data (which we have with our power numbers study) has a standard deviation that is more than half of the mean, it is an indication that the data deviates substantially from a bell shaped curve. Almost always this is an indication of a skewed distribution.” The second column to the end (right side) indicates if the distribution of repeat, same bike readings has a skewed distribution or not.
Bike 14 tested 3 separate times, looking for consistency between tests, for reliability to set bike handicaps.
With bike #14, it is notable that Trial #2 and #3 area actually fairly close except for at the 175 Watt stage. However, when we add our first set of numbers to the analysis, all but two wattage levels are skewed. If we just consider 1 bike, we might make a case that if we were to do 5 to 10 repeat trials, we might see these better numbers continue. This was something Sarah (our statistician) suggested as a next possible phase of the research; to conduct a much higher number of trials to see if we begin to see greater consistency or normalcy to the data.
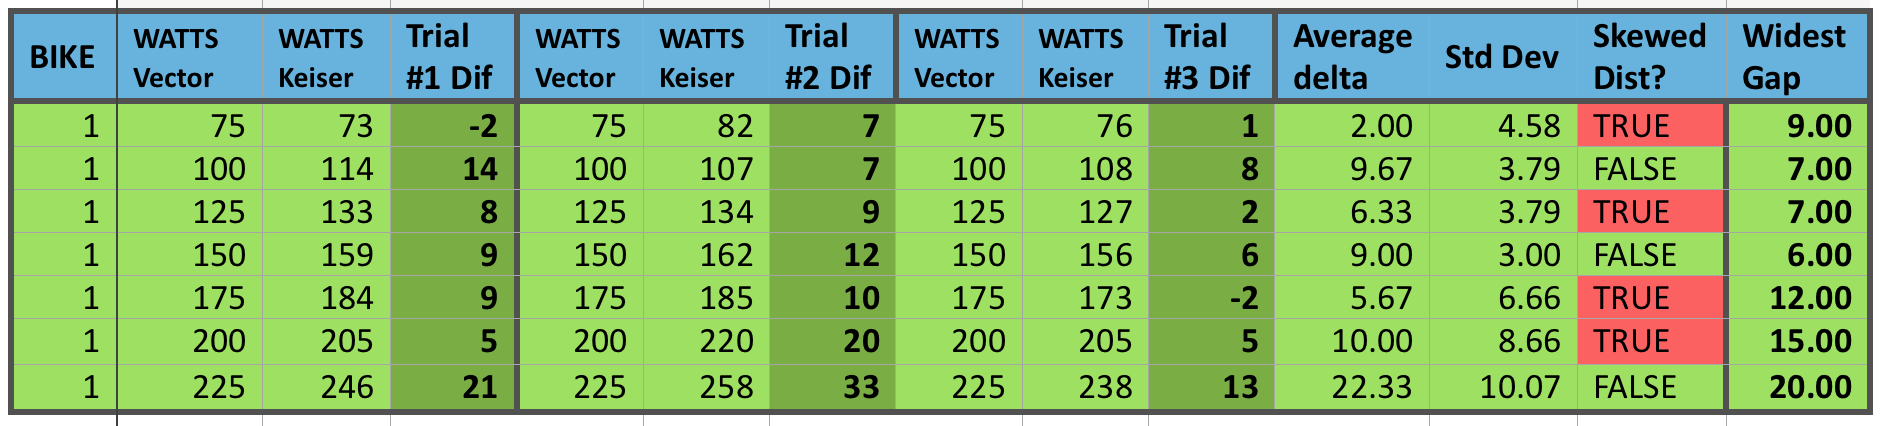
Bike 1 tested 3 separate times, looking for consistency between tests, for reliability to set bike handicaps.
Again, with bike #1 we have only 2 out of 7 different wattage stages that are not demonstrating a skewed distribution of data. At a “gut feel” level, I was hoping to see less than 5 watts difference between measurements of power when it was the same stage. I was willing to accept a difference of 10 watts since accuracy was still not the main driver here. However, again we must remember this is not the power difference, but just the repeating values on the same bike — how reliable it is for a consistent representation of power. Unfortunately, 30% of all the individual stages rendered differences greater than 10 watts and statistically 4 out of the 7 stages were considered skewed.
A Glimmer of Hope?
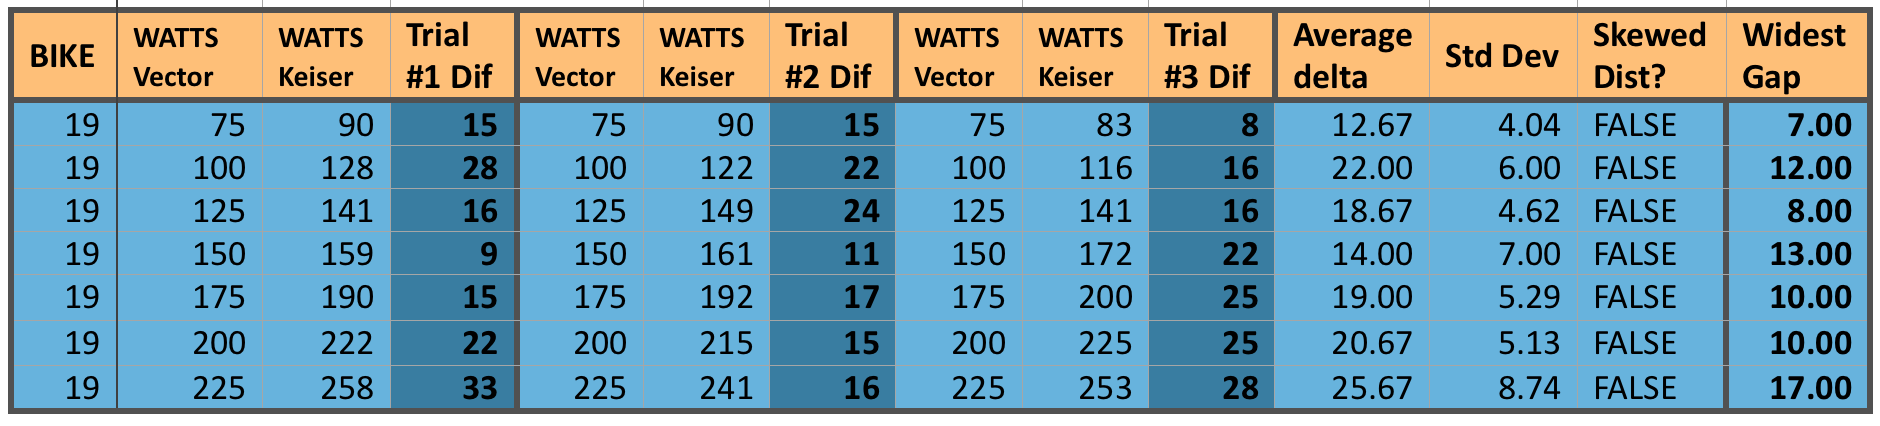
Bike 19 tested 3 separate times, looking for consistency between tests, for reliability to set bike handicaps.
Our last bike does seem to show a glimmer of hope though. While this specific bike had some of the largest differences in actual to measure power differences (in the 15 to 25 watt range), at least it showed those big swings fairly consistently. Notice how small the Standard Deviation is compared to the average delta (simply means the difference) among all three trials. This thus demonstrates a more “normal” distribution and could indeed support a type of “Power Handicap”.
So perhaps I have saved the good news for last. Maybe… just maybe, this means that some bikes would be amenable to a type of handicap while others may not. Picking up on Sarah’s suggestion, a lot more research (translate that — time spent repeating tests on the same bikes, many bikes) might lead to a set of bikes that are “good to go” with a handicap, and a set that are not. Naturally, being the proverbial curious cat, I would want to find out if there is some reason the unreliable bikes are that way. We might even be able to take those bikes through a preventive maintenance routine, recalibrate them to the furthest extent, and repeat the same retests. If we come up with a majority of the bikes being statistically solid and reliable, then we have not only created a handicap system, but we’ve validated the calibration method.
However, having spent as many hours as I have so far on this project, I’ve hung my lab coat up for now, so you won’t be blinded by science from me or a while. If I were Keiser corporation though, I believe I would have a vested interest in picking up where this research left off. I have moved this conundrum past the “blank page” and created a possible path that they could very well negotiate to a workable solution for their clients. Perhaps many clients don't care. I get that – not everyone even uses the training tools. Yet they were bold enough to lead the industry with power and have played a major role in seeing this industry change for the good. I believe Joe Public is becoming increasingly more savvy when it comes to training, and this is rapidly becoming a more educated marketplace. Especially if they consider just their own clients, such an undertaking should be received very well, supporting their image as a company that takes training seriously enough to put in the time and energy to make it right.
Time To Dig In
So we’ve painstakingly done everything possible to setup and prepare our methods for a solid research project — at least as solid as any “non-university” research setting can hope for. We’ve not only established a consistent protocol for conducting the tests, but we’ve also made sure to not do too many in any one day, nor to use different testers to eliminate potential influences to our results.
Once we executed these tests on about a dozen bikes, I wanted to start to analyze the data, and that’s when it occurred to me that we needed to make sure that the numbers I was about to analyze were reliable and repeatable from bike to bike. My last post demonstrated the process of re-testing to insure that very thing. After doing retests on about 6 of the 12 bikes, it is now finally time to review the data and see just what is what.
Let’s Start With The First 2 Bikes
Each day I tested only 2 bikes — to make sure I was fresh each time. So naturally, my first peak at the numbers (and I try not to look at them until I am well into the research so that initial impressions do not subconsciously alter my performance as more tests are conducted) came after these first 2 retests. Remember, I’m into the research project a couple of months now without letting myself “have a taste” — that’s pretty tough for a data-geek like me ☺. So below you will see the first two bikes retested. Let’s go over the columns so we can understand what we are looking at.
1st Keiser m3 Indoor Cycling bike with power to be tested & retested.
2nd Keiser m3 Indoor Cycling Power bike tested with the Garmin Vector Pedals
The first column represents the 25 Watt stages that were used to get the average power numbers from. These were “settled into” for 2 to 3 minutes at each of these stages. More specifically I used the Keiser console to establish a steady wattage level during each stage, and then once the 2.5 minutes were up, I stopped the keiser to get the true average (which typically was within 5 watts of the target) and we also lapped the Garmin so it would later give us the average or “Normalized Power” (NPower is how I have referred to it on the table) from the Garmin Vector Power Pedals.
Column: Keiser Power Div by Garmin NPower
By dividing the calculated power of the bike by the measured power from the Vector power pedals, we will see by percentage just how close they are to each other. Remember, we are not concerned about pure accuracy per se — we know the calculated power is going to be inaccurate by its nature — we simply want to know how much it is off, and if that amount is reliable every time re ride that bike. Each percentage is a reflection of both bikes at a specific wattage on one test.
Column: Degree of Variation
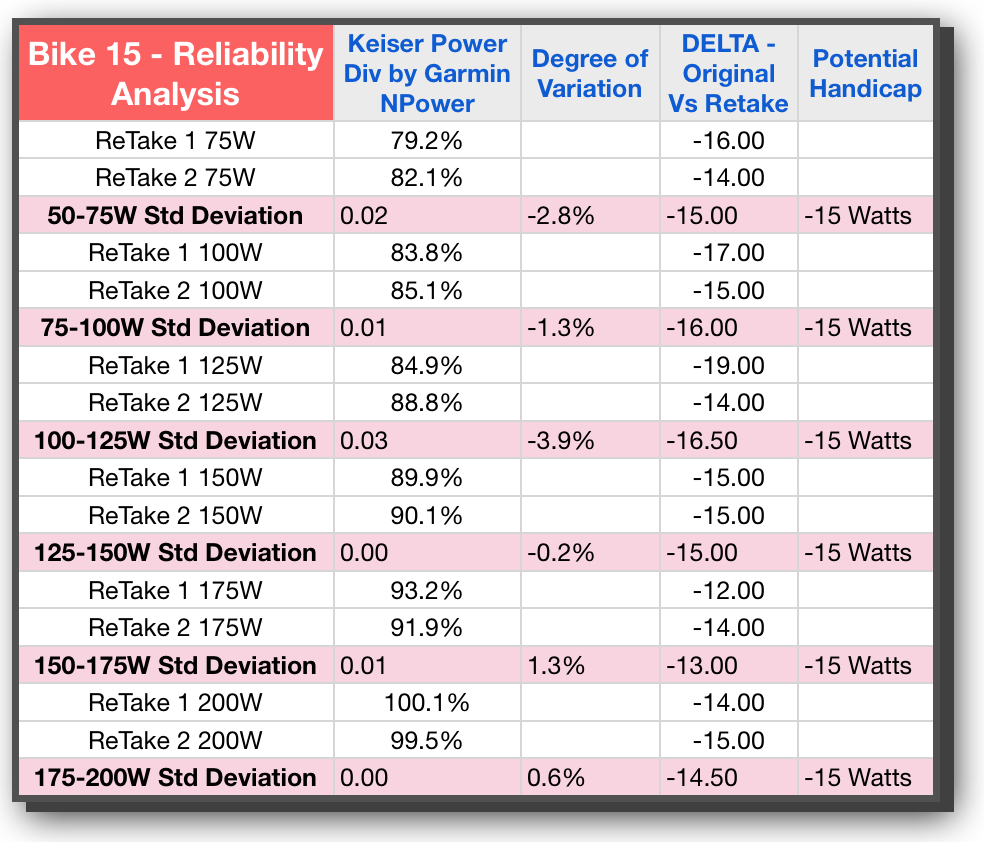
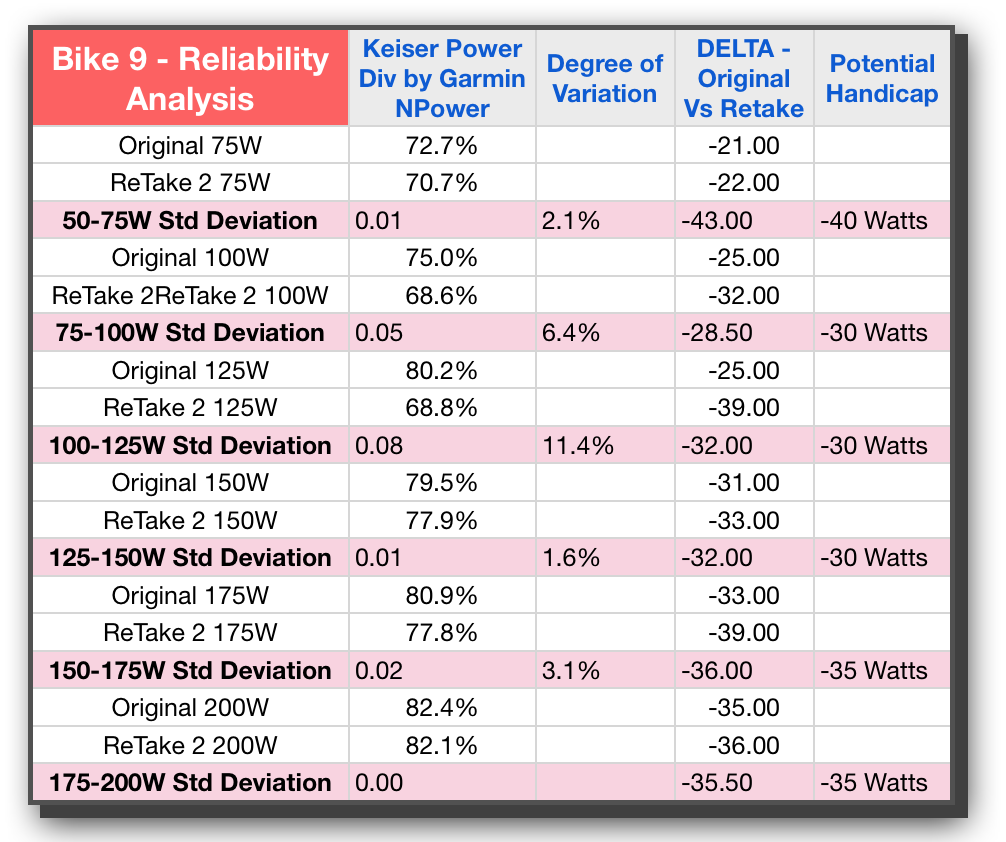
If we now take the difference between the first test and the next, we can get at how reliable the bike is between test sessions. This is the KEY metric for our purposes during this phase of the study; validating that each bike within itself is reliable. From a practical standpoint, we need the difference between tests to be low if our handicaps are going to be valid and useful from one class to the next. In looking at both Bike 15 and Bike 9 we see that these are indeed fairly low — an initial good sign — and there is only one instance where the difference is over 10%. That’s actually a lot less than I expected.
Column: DELTA Original vs Retake
This is a “pre-handicap” column — showing the exact wattage differences at each stage of power averages. While this will produce precise numbers with decimals, we know that a practical application of handicaps would likely need to be in increments of 5 so that the math is easier when performing that handicapping in ones head. We could also use this to send to an automated system if one was ever created that could account for bike variations in the software (an insightful feature I would create if I were the purveyor of such software).
we use this column to evaluate the exact differences and averages before we designate a specific handicap number.
This column is the one that also really shows the amount of variation from one bike to the next. On Bike 15 we are averaging in the teens with wattage differences, whereas Bike 9 is averaging in the 20s and 30s. That’s quite a spread.
Column: Potential Handicap
This column would represent the entire motivation and impetus for all of the time and energy being spent on this research. We want to handicap the bikes! If you’ve read my eBook on Power (if not, no worries an updated iBook is due out soon — shameless plug apologies ☺ ), you will know that Power is not linear in its progression. As such we can not just use one number as the handicap and apply that to all wattage levels. If you look at all 4 bikes, you will see, with the exception of Bike 15, the differences get bigger and bigger as the wattage level increases. This is the exponential nature of power and the reason why I propose a handicap value for every 25 or 50 watts.
How About Some Analysis
Up to now, we’ve only sprinkled the analysis or possible conclusions as I’ve described each column. However, in order to even think about drawing conclusions, we will need more data points than just 2. Lets’ show four more bikes so we can see if there are some patterns emerging when we have 6 total bikes and their retests — giving us a total of 12 tests or sets of data points to consider.
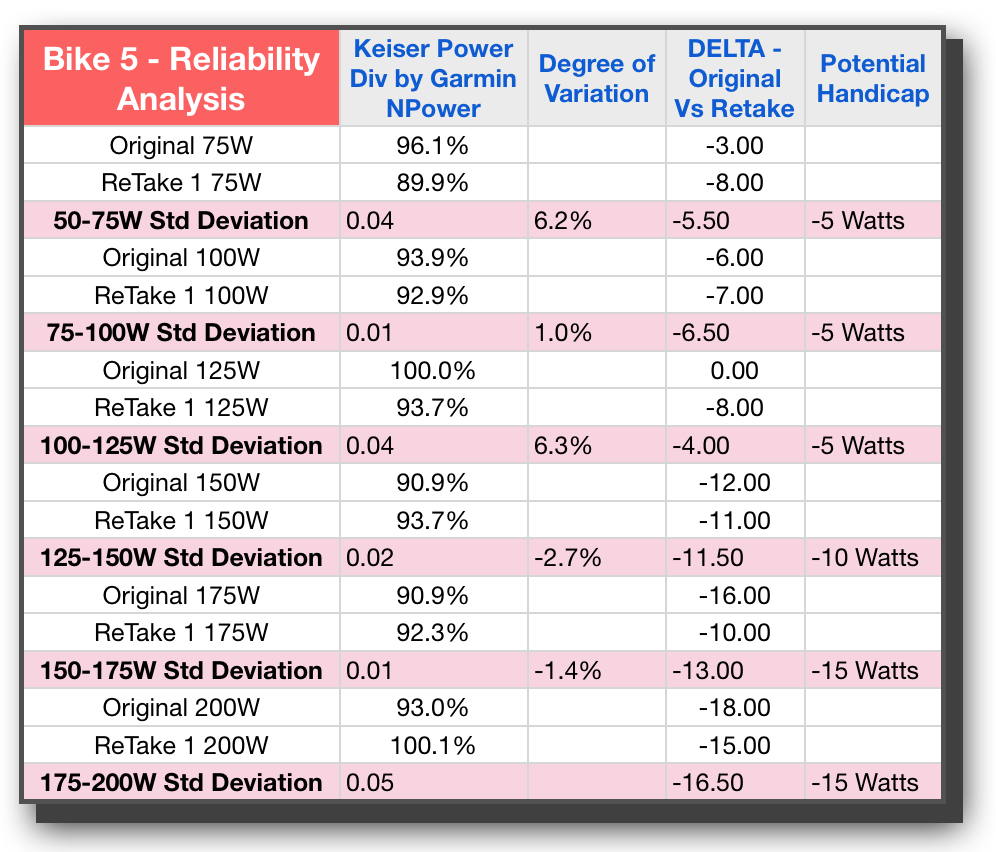
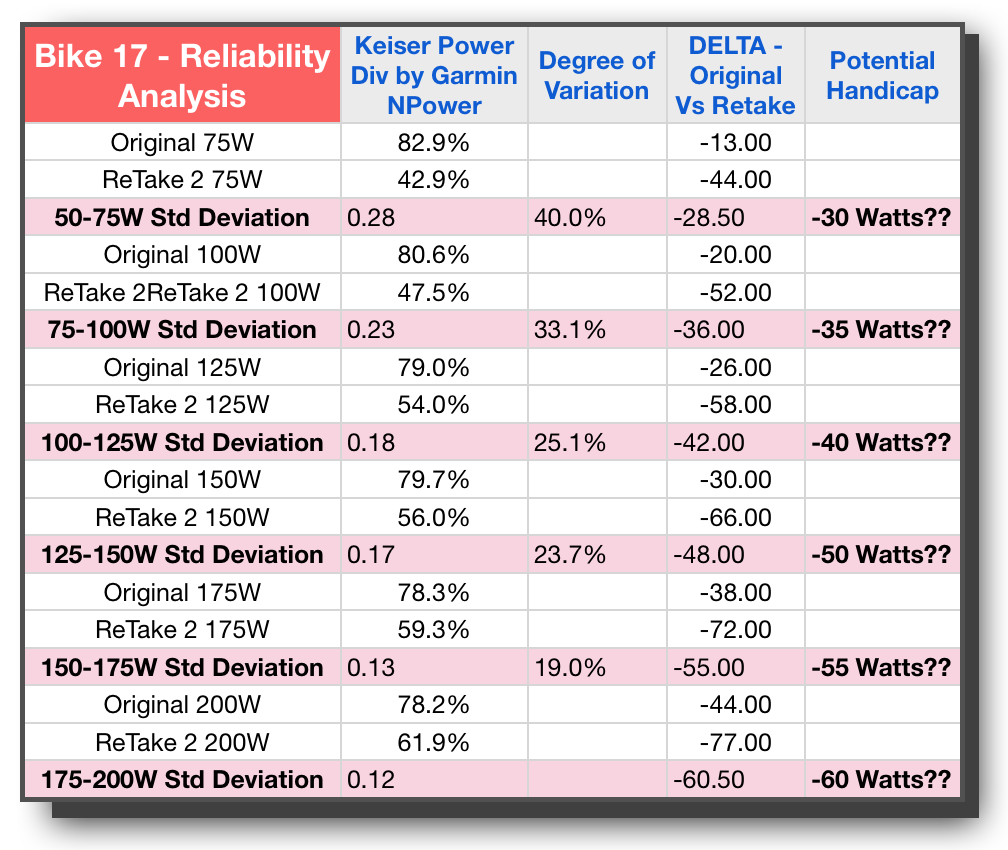
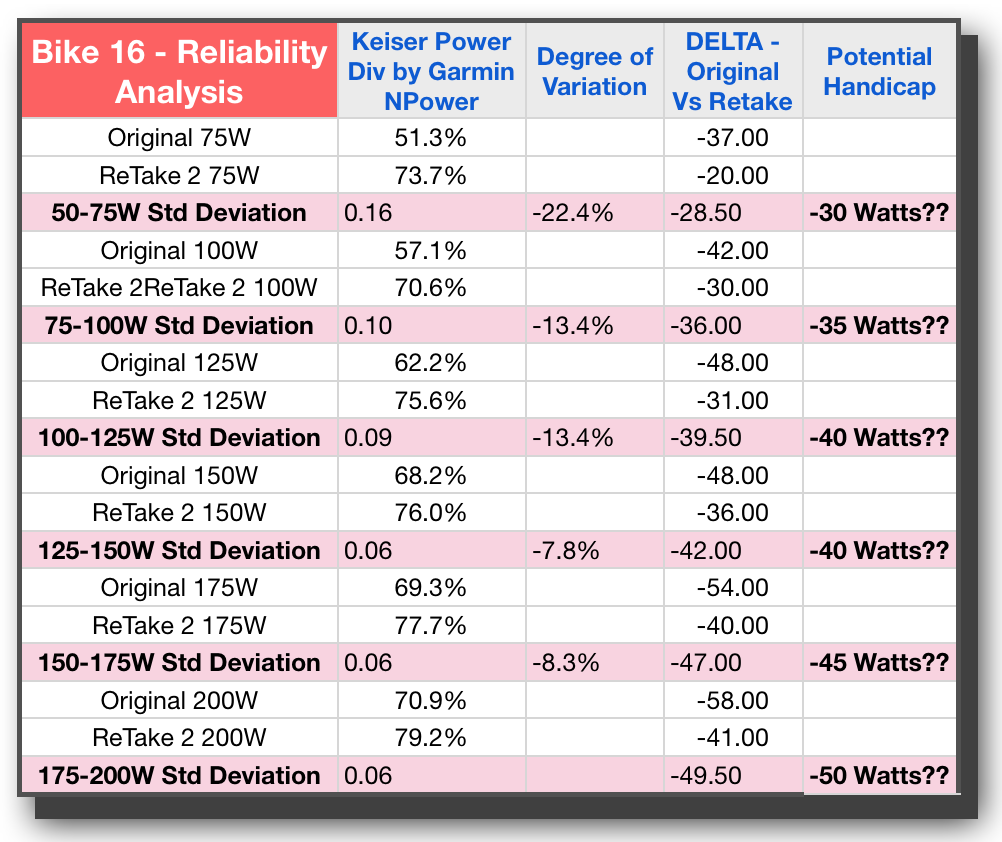
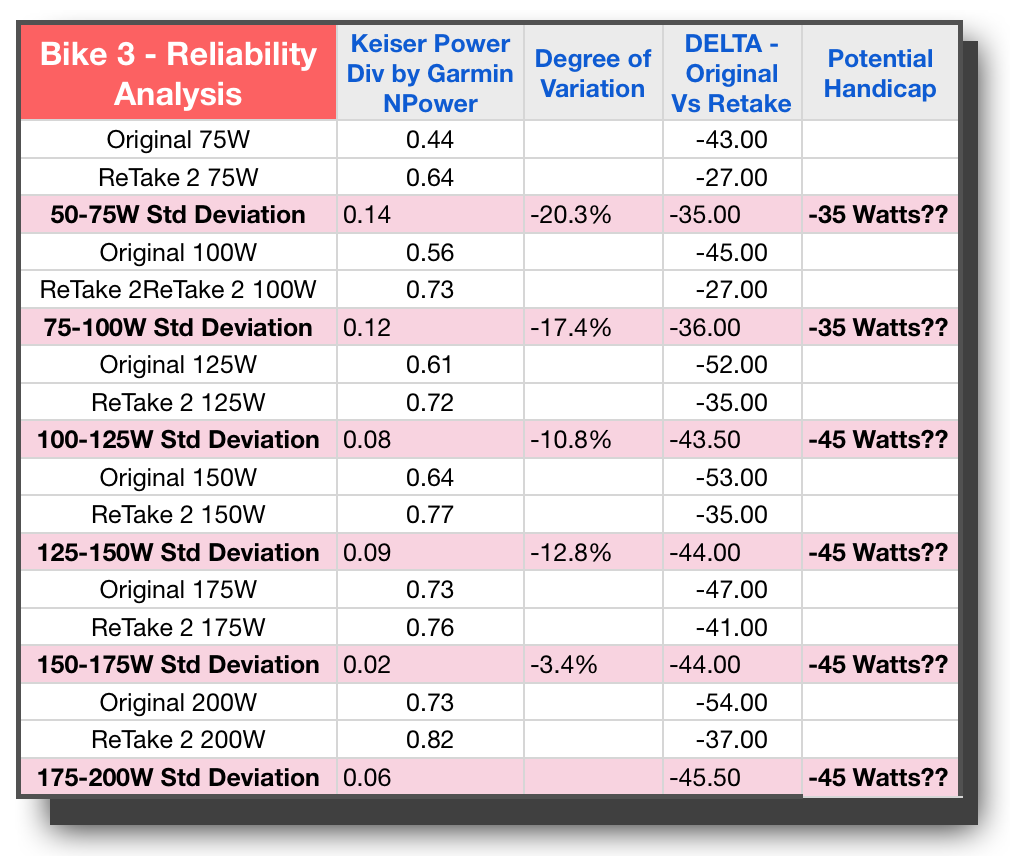
Looking at Bike 5 I’m feeling pretty good that it’s similar to #9, this time with all variation under 10% and the good power-like escalation of Potential Handicap wattage going up as a power curve would reflect. Taking a look at Bike #17 though, and I had to do a double take — WHAT?? or should I say “WAATTT!” The degree of variation is crazy. Not only that, even looking at it from a practical perspective, the Potential Handicap, aside from being huge in the 30 to 60 watt range, is simply not close to either of the trials in this study. While 30 Watts may indeed be the average between the two tests, with one being 13 and the other being 44, who knows if 30 will be too much or too little. In fact all of the stages are reflected as pretty wild for Bike 17.
Unfortunately the bad news continues with Bike 16 and Bike 3. Both of these bikes have variations well above 10% and similar wide swings in Watts for the original delta between tests. In addition, we have bike #3 not demonstrating the proper power curve through the last 4 stages, but instead settling into one consistent difference in wattage.
Looking again specifically at these last 3 bikes, and there is no way I would be comfortable handicapping these bikes and expect it to be consistent. So all in all, we have 3 bikes that look like they would lend themselves to reliable handicaps, and three that do not. With a split decision like that, we are all but a hung jury here.
Since I recognized that I might be the problem — I am the only one conducting the tests – and while it stands to reason I would get better and more consistent over time not less, I did not want to rule that out. This data left me scratching my head more than anything else — more questions that need to be anwered. It was time to bring in bigger guns than I have.
The next blog will have another video where we brought in a professional statistician to help us get to the bottom of this.
Making sure this process is repeatable with each bike tested is essential to our objectives.
Let’s recap what we’ve done so far in our video blog series:
1. We have introduced the whys and wherefores of this Indoor Cycling Power research project
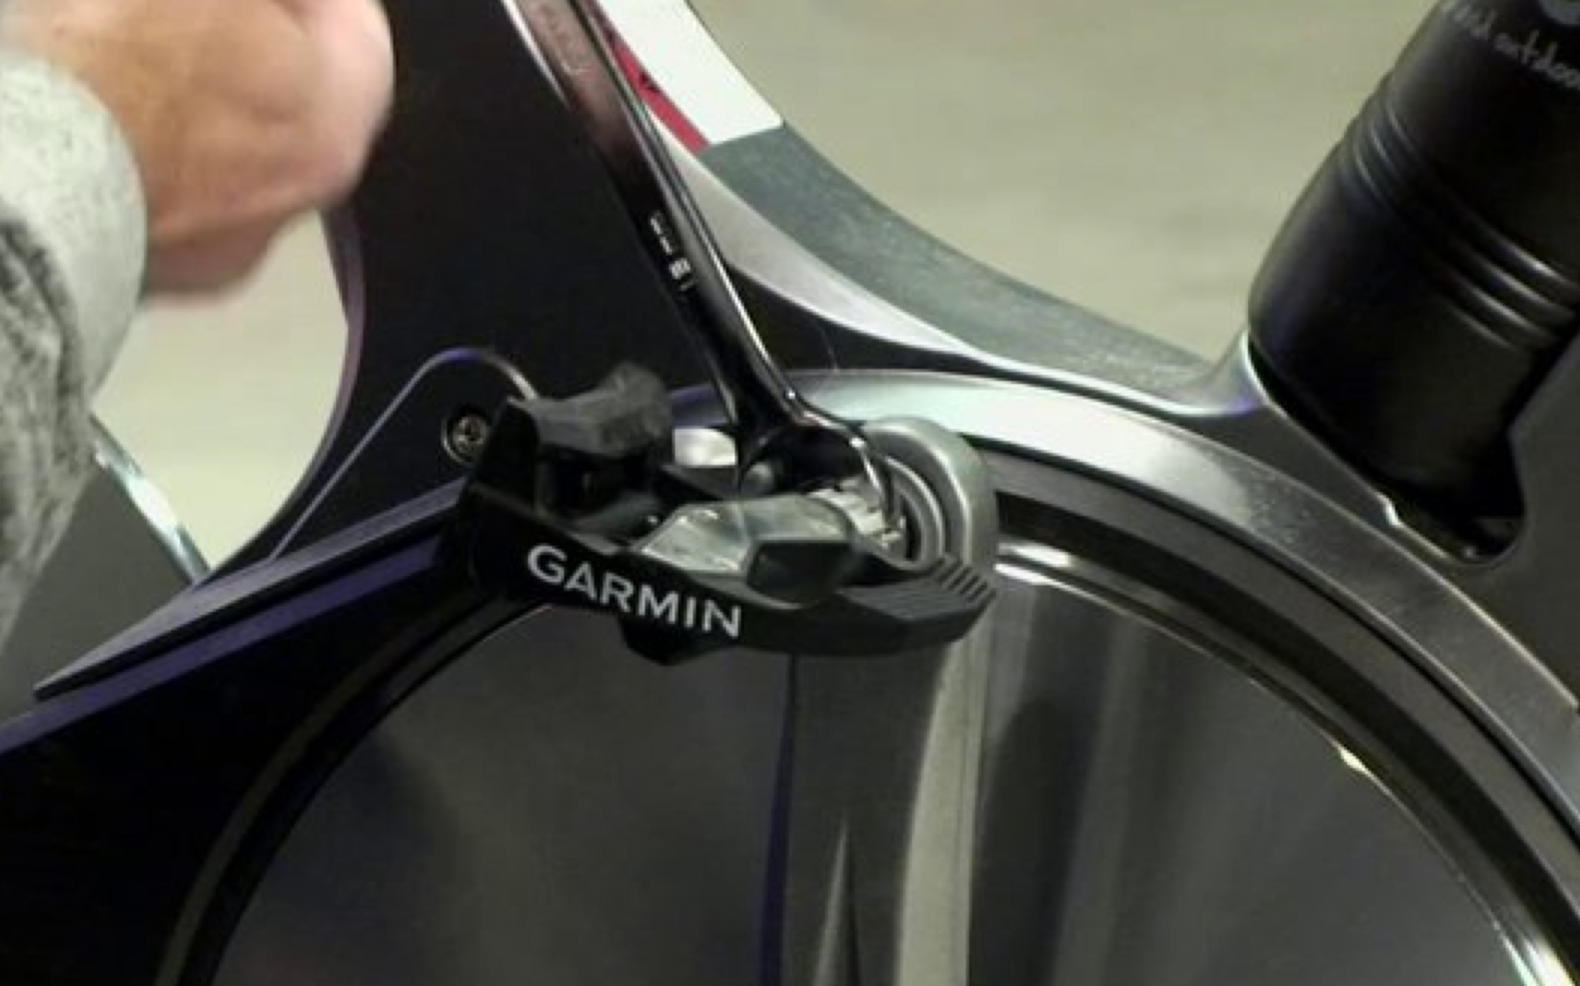
2. We’ve shown exactly how the Garmin Vector pedals get mounted to the Keiser m3 indoor cycle bike
3. We’ve demonstrated from start to finish, the precise protocol used in conducting repeatable tests on each bike
4. Last week we stepped through the process for getting the data from both the Garmin bike computer and the Keiser m3 console (manually recorded) put into the a consolidated spread sheet.
Accuracy & Reliability Are Two Different Things
This week we move into the steps required to begin validating the reliability of our equipment and/or our process. This is as crucial a consideration as the pure accuracy of the data. If we can’t confirm that our process of measuring power is consistent on any one given bike from one day to the next, how can we expect to handicap the bike for accuracy with a number or even series of numbers for different wattage levels since an unrepeatable test would mean this handicap would not be valid from one day to the next.
Consider the frustration of weighing yourself each day on a scale that can not show you 50 lbs from a 50lb weight from day to day. On some days you’ll be depressed while others you’ll be “woo hooing” all the while your weight has stayed the same. It’s an absolute critical component of our findings; to know what we are doing is repeatable and reliable. If it isn’t, we need to consider if the process is changing and causing the inconsistencies, or if the equipment is doing so. While I have tried to be more than methodical about every aspect of this process from pedal calibration to bike test execution, I will not rule out tester error or inconsistency for the moment. Let’s just first see how our numbers turn out before we decide which factor to consider (test process, or equipment variability).
Coach Gino Explains Why Validation & Reliability Are Important
The 2 video segments that make up this post are both quite short. The first one describes in detail how to unmounts the Vector Power pedals in order to use them on a second bike. It is important that we don’t just leave the pedals on and do multiple tests on the same bike. This would not tell us if that bike will be reliable one day to the next. We must first test other bikes, and then come back to bikes we’ve tested.
The second video segment is showing one complete test again (like our 2nd video), only this time on one of the bikes already tested from a previous session.
Not practicing the hand-off – but what comes next…
One of the many benefits of riding and training indoors, is not worrying about crashing and ending up on your head. So we practice our; pedaling technique, or Sprint form or whatever, without thinking about balancing or where we're going.
Now if we were riding our road bikes on trainers we could also practice reaching down, grabbing a bottle, taking a drink and then returning it safely into the cage. Not an easy task for many new (and a few old) outdoor cyclists.
Bicycle Safety Tip
2012 Tour de France winner Bradley Wiggins pictured above/right may be an awesome cyclist with phenomenal bike handling skills. But he's not demonstrating proper hand position with one hand off the bars. The correct (safe) position for his left hand is on the cross bar, very close to the center / stem. Why not out at the end where he has it in the picture?
It's a matter of leverage. The further you hand is, away from the center/pivot, the easier it is to turn the bars. Without your other hand to counteract the force, riders with just one hand, on the outer end of the bars, tend to ride erratically = not in a straight line = dangerous.
Speaking of proper hand positions > I discovered this video while researching this article. Nothing to do with cycling, but it will get your heart rate up when you watch it 🙂
In celebration of today being the Super Bowl (the biggest sporting event in North America) we played drinking games. Not the typical; take a shot whenever an announcer uses some predictable cliche – that comes later today.
In class we played a different type of drinking game.
Although we're not on real bicycles, there's still a valuable technique we can safely practice during class; drinking at a high level of effort > @ or over FTP/Threshold/AT/Lt whatever you call it. More specifically; learning to regulate your breathing so you don't choke, launch into a coughing fit, swerve over and ultimately take down your riding buddy – or end up in the ditch.
NOT drinking enough during a long ride is the sure path to early fatigue. During a hard group ride there may not be a lot of breaks where you can recover and hydrate easily. So today we only drank during hard efforts, not during the recoveries when you would normally towel off and take a sip.
The first Sunday of each month is an FTP Assessment. Here's my class.
Class length 75 minutes + Cool Down
Warm Up — 10 minutes. 5 minutes of gradual increases in wattage. During the second 5 mins. we’re finding the wattage where everyone is first noticing a change in breathing; VT1 / Aerobic Threshold = the top of the Recover Zone. This establishes a rough understanding of a base wattage that we use throughout the rest of class.
3 x 30 sec. Hard / 30 sec. Easy – Openers to AT/LT. I cue these by first having everyone find the amount of load @ 70 RPM that has them feeling they should (not just could) come out of the saddle. The 30 sec. Hard is then simply accelerating to 90+ RPM which results in some pretty impressive power numbers. The 30 sec. Easy is back to 70 RPM — many will stand during the Easy portion.
1 minute rest – I encourage riders to focus on their recovery. Once they feel calm in their breathing, bring back the Base level work wattage.
3 min. Hard Effort — Here’s a “Best Effort” to establish a benchmark PTP Personal Threshold Power (top of the Perform Zone) or ride at 110% of FTP if known. It’s very helpful to riders to have that understanding of their personal upper wattage number. The “Best Effort” Threshold # + the Base Threshold # we found earlier form the three Power working zones I use in class.
2 min. Rest
3 x 1 min. Hard Effort x 1 min. Rest. These should be above the 3 minute average wattage.
3 min. Rest
20 min. TT / FTP Assessment effort – Quickly establish the average wattage at or near the 3 min. Interval. > Stage Button and then maintain. You may want to offer slight changes in cadence & load, while keeping wattage = to the initially established watts #. I was off the bike at the 10 min. to go, coaching, encouraging and then just watching them with a big smile on my face. This is a great group and they looked incredible — I’m so in my element with these classes
5 min. Rest
Base Wattage (aerobic) flat road to finish — use these time to congratulate everyone and give tell them a bit about what you have planned for them next week.