
Different Methods Same Skewed Results

A different approach with a professional researcher still produced mixed results
Let’s start with the good news. I’m sorry, I was completely pulling your leg. I really don’t have any good news. I know, that’s terrible — you can throw pencils and small farm animals at me next time you see me. I was really looking for the good news in these results and I just can’t find any. This last series of retesting the same three bikes to see if we could garner the same or similar results each time we measure the bike has led to 2 out of the 3 bikes demonstrating a “skewed distribution” of data. In other words, data that you could not and should not try to predict with because they are in a word, unreliable. That means my hope for creating a “handicap” for each bike to render them even and fair for comparisons and competitions is not possible.
Statistical measurements often use Standard Deviation to determine how much variation there is in the individual readings or occurrences of data (in our cases — the differences between the actual power and the measured power). There is something called the “Emperical Rule” (http://www.pmean.com/08/SdTooBig.html) “…it says that approximately 95% of the data lies between plus and minus two standard deviations of the mean.” This 95% rule is for data with a “normal distribution”. This is what we were hoping for when we measured the same bike several times.
Please remember, this stage of the research was RE-measuring the same bikes, not measuring the differences in power between bike computer and actual power of the power pedals. We knew all along the pure accuracy would not be there, we were simply hoping that the amount or degree to which it was “off” would be consistent.
So getting back to our “Empirical Rule”. There is a corollary to that principle, and that is “If a non-negative set of data (which we have with our power numbers study) has a standard deviation that is more than half of the mean, it is an indication that the data deviates substantially from a bell shaped curve. Almost always this is an indication of a skewed distribution.” The second column to the end (right side) indicates if the distribution of repeat, same bike readings has a skewed distribution or not.
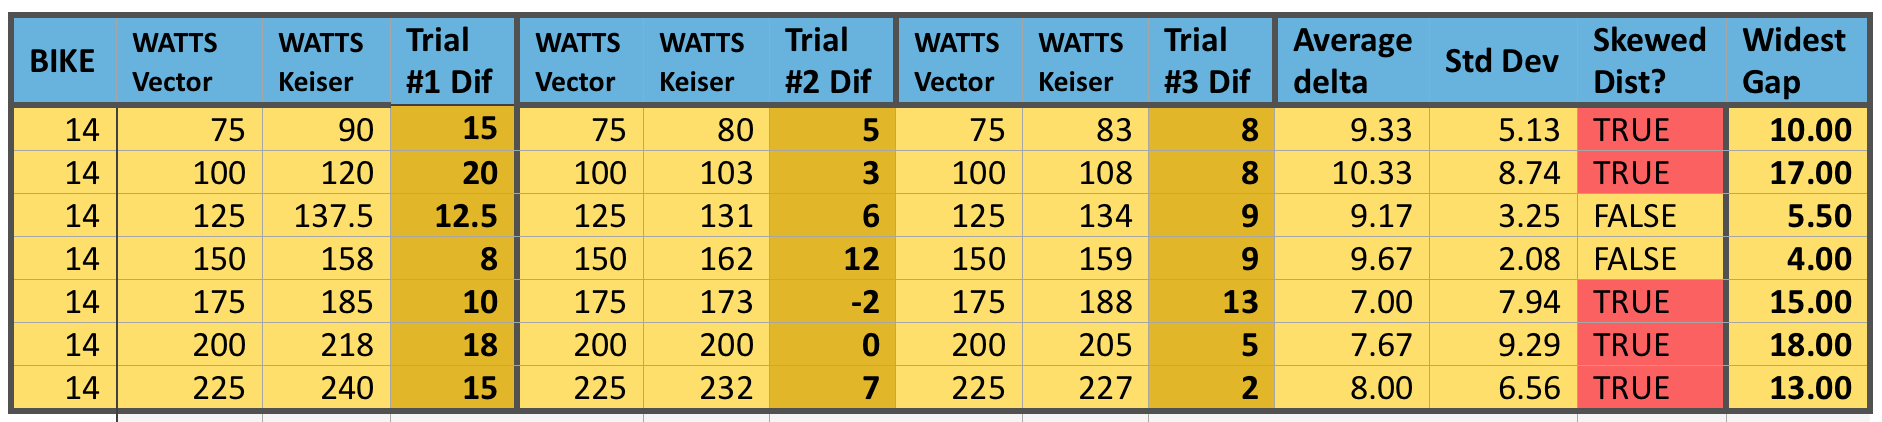
Bike 14 tested 3 separate times, looking for consistency between tests, for reliability to set bike handicaps.
With bike #14, it is notable that Trial #2 and #3 area actually fairly close except for at the 175 Watt stage. However, when we add our first set of numbers to the analysis, all but two wattage levels are skewed. If we just consider 1 bike, we might make a case that if we were to do 5 to 10 repeat trials, we might see these better numbers continue. This was something Sarah (our statistician) suggested as a next possible phase of the research; to conduct a much higher number of trials to see if we begin to see greater consistency or normalcy to the data.
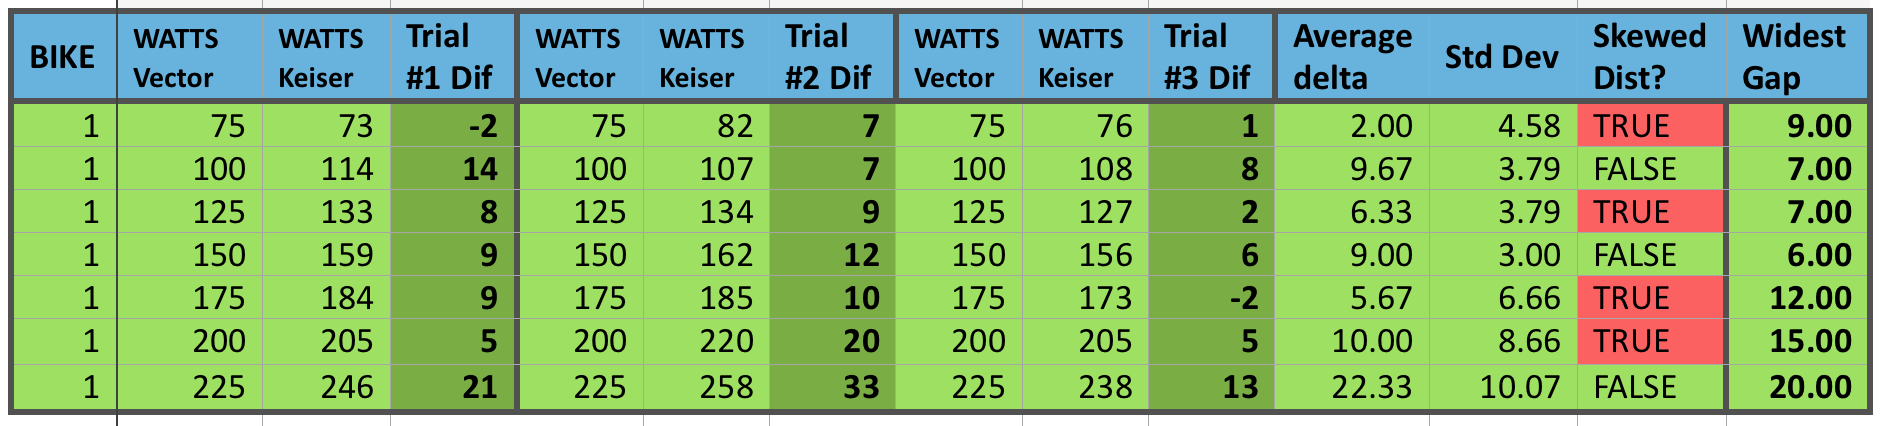
Bike 1 tested 3 separate times, looking for consistency between tests, for reliability to set bike handicaps.
Again, with bike #1 we have only 2 out of 7 different wattage stages that are not demonstrating a skewed distribution of data. At a “gut feel” level, I was hoping to see less than 5 watts difference between measurements of power when it was the same stage. I was willing to accept a difference of 10 watts since accuracy was still not the main driver here. However, again we must remember this is not the power difference, but just the repeating values on the same bike — how reliable it is for a consistent representation of power. Unfortunately, 30% of all the individual stages rendered differences greater than 10 watts and statistically 4 out of the 7 stages were considered skewed.
A Glimmer of Hope?
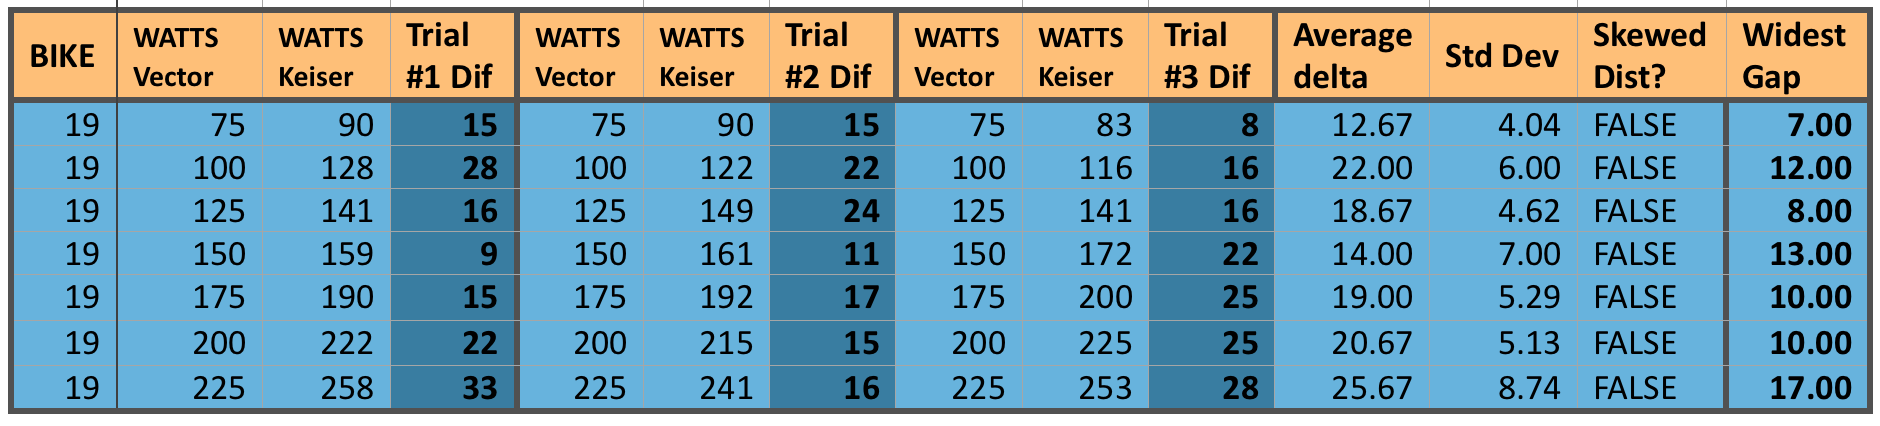
Bike 19 tested 3 separate times, looking for consistency between tests, for reliability to set bike handicaps.
Our last bike does seem to show a glimmer of hope though. While this specific bike had some of the largest differences in actual to measure power differences (in the 15 to 25 watt range), at least it showed those big swings fairly consistently. Notice how small the Standard Deviation is compared to the average delta (simply means the difference) among all three trials. This thus demonstrates a more “normal” distribution and could indeed support a type of “Power Handicap”.
So perhaps I have saved the good news for last. Maybe… just maybe, this means that some bikes would be amenable to a type of handicap while others may not. Picking up on Sarah’s suggestion, a lot more research (translate that — time spent repeating tests on the same bikes, many bikes) might lead to a set of bikes that are “good to go” with a handicap, and a set that are not. Naturally, being the proverbial curious cat, I would want to find out if there is some reason the unreliable bikes are that way. We might even be able to take those bikes through a preventive maintenance routine, recalibrate them to the furthest extent, and repeat the same retests. If we come up with a majority of the bikes being statistically solid and reliable, then we have not only created a handicap system, but we’ve validated the calibration method.
However, having spent as many hours as I have so far on this project, I’ve hung my lab coat up for now, so you won’t be blinded by science from me or a while. If I were Keiser corporation though, I believe I would have a vested interest in picking up where this research left off. I have moved this conundrum past the “blank page” and created a possible path that they could very well negotiate to a workable solution for their clients. Perhaps many clients don't care. I get that – not everyone even uses the training tools. Yet they were bold enough to lead the industry with power and have played a major role in seeing this industry change for the good. I believe Joe Public is becoming increasingly more savvy when it comes to training, and this is rapidly becoming a more educated marketplace. Especially if they consider just their own clients, such an undertaking should be received very well, supporting their image as a company that takes training seriously enough to put in the time and energy to make it right.
- Think Like A Researcher – Blog Post #9 - August 5, 2021
- Power Training for Indoor Cycling Is Here - March 26, 2021
- Me & My Big Mouth - March 26, 2021
Gino,
I’m sorry it didn’t work out. Hopefully Keiser will take the research to the next level.
Since the goal was ‘handicapping’ in an effort to make possible the most real competition on a level playing field where do you go from here?
What impact do you think such inconsistencies have on the use of such products a PerformanceIQ?
Really interesting, Gene. I can understand inconsistency, if it is consistent 🙂
Those who train with power want to rely on the data they are receiving.
Thank you for your research!
I’ve been hesitant to respond because I’ve been torn on the whole subject of group displays as they relate to power. I like seeing young entrepeneurs doing well, and I’ve had these guys over at my house advising them on their business. Yet, there are some serious issues that are being swept under the rug with this concept. It’s not just Performance IQ’s product, but the whole group display approach has some significant challenges that will likely put the instructor on a hot seat they don’t deserve.
I abhor being negative just to be negative, however, it’s one of those things that once you see something, you can’t “un-see it”. Aside from the problem of the bikes not reflecting your true effort — that is a problem I saw in action first hand with my own riders on my own bikes, and why I conducted all that research. The more damaging problem though is that once they are wise to it, the entire effort loses credibility, and my outdoor riders that I worked so hard to pull inside will now begin to think “What’s the use – we can’t rely on the data – why do all that training and data collection.
In fact, when they came to my studio a couple of years ago, and one of the guys was destroying the other with Watts, I saw how frustrated the “losing guy” was, as I knew their abilities and the bikes. I had them switch bikes before the final stage/bout – and as I predicted the guy who was losing trashed the guy who was riding consistently on top.
I knew then that I could do more harm than good if I were not careful, and that’s one of the big reasons I would not consider a group system until I could adequately “solve” the power discrepancies. I was willing to go with handicapping to get there, but alas it is not to be.
As an aside, this is one of the reasons Heart Rate and Cadence still offer SOOO much value for the instructor. These are metrics you can count on for sure, and that can offer an amazing degree of variety and solid training results from.
But power is still a passion of mine, and I will not give up until I find a workable solution.
Roger that Gene. This does become an issue for many of us. I have an FTP assessment class tomorrow (1st Sunday of each month)and I’m lucky that I have attentive staff that will perform the zero resets on all of the FreeMotions in the room. But there’s still the nagging doubt some have; “Is this really my FTP?” “Next week… on a different bike… can I confidently use these numbers?”
Then I find myself questioning our approach. Are we running down a rabbit hole here? Trying too hard to become cycling coaches – forgetting most of our participants are at best “club athletes” or maybe weekend warrior-cyclists. It maybe time for some introspective consideration on our part.
Thanks Gino,
I knew I put you on the spot but the question – from the perspective of the instructors reading this – needed to be asked.
You are spot on regarding heart rate and cadence.
I see the next big advancement on indoor cycle as somehow auto sensing heart rate. Seriously, most floor based cardio equipment (treadmills, ellipticals, stair masters and bikes) already give the user the option to sense heart rate by holding the sensor. This is just an educated guess but such sensors seem to reasonably match my own heart rate monitor (Blink) so my guess is they’re repeatable enough to use so long as there is not a age based heart rate chart next to them. 😉
If you give it to them, they will use it.