

It's time to look at the data gathered so far.
Time To Dig In
So we’ve painstakingly done everything possible to setup and prepare our methods for a solid research project — at least as solid as any “non-university” research setting can hope for. We’ve not only established a consistent protocol for conducting the tests, but we’ve also made sure to not do too many in any one day, nor to use different testers to eliminate potential influences to our results.
Once we executed these tests on about a dozen bikes, I wanted to start to analyze the data, and that’s when it occurred to me that we needed to make sure that the numbers I was about to analyze were reliable and repeatable from bike to bike. My last post demonstrated the process of re-testing to insure that very thing. After doing retests on about 6 of the 12 bikes, it is now finally time to review the data and see just what is what.
Let’s Start With The First 2 Bikes
Each day I tested only 2 bikes — to make sure I was fresh each time. So naturally, my first peak at the numbers (and I try not to look at them until I am well into the research so that initial impressions do not subconsciously alter my performance as more tests are conducted) came after these first 2 retests. Remember, I’m into the research project a couple of months now without letting myself “have a taste” — that’s pretty tough for a data-geek like me ☺. So below you will see the first two bikes retested. Let’s go over the columns so we can understand what we are looking at.
1st Keiser m3 Indoor Cycling bike with power to be tested & retested.
2nd Keiser m3 Indoor Cycling Power bike tested with the Garmin Vector Pedals
The first column represents the 25 Watt stages that were used to get the average power numbers from. These were “settled into” for 2 to 3 minutes at each of these stages. More specifically I used the Keiser console to establish a steady wattage level during each stage, and then once the 2.5 minutes were up, I stopped the keiser to get the true average (which typically was within 5 watts of the target) and we also lapped the Garmin so it would later give us the average or “Normalized Power” (NPower is how I have referred to it on the table) from the Garmin Vector Power Pedals.
Column: Keiser Power Div by Garmin NPower
By dividing the calculated power of the bike by the measured power from the Vector power pedals, we will see by percentage just how close they are to each other. Remember, we are not concerned about pure accuracy per se — we know the calculated power is going to be inaccurate by its nature — we simply want to know how much it is off, and if that amount is reliable every time re ride that bike. Each percentage is a reflection of both bikes at a specific wattage on one test.
Column: Degree of Variation
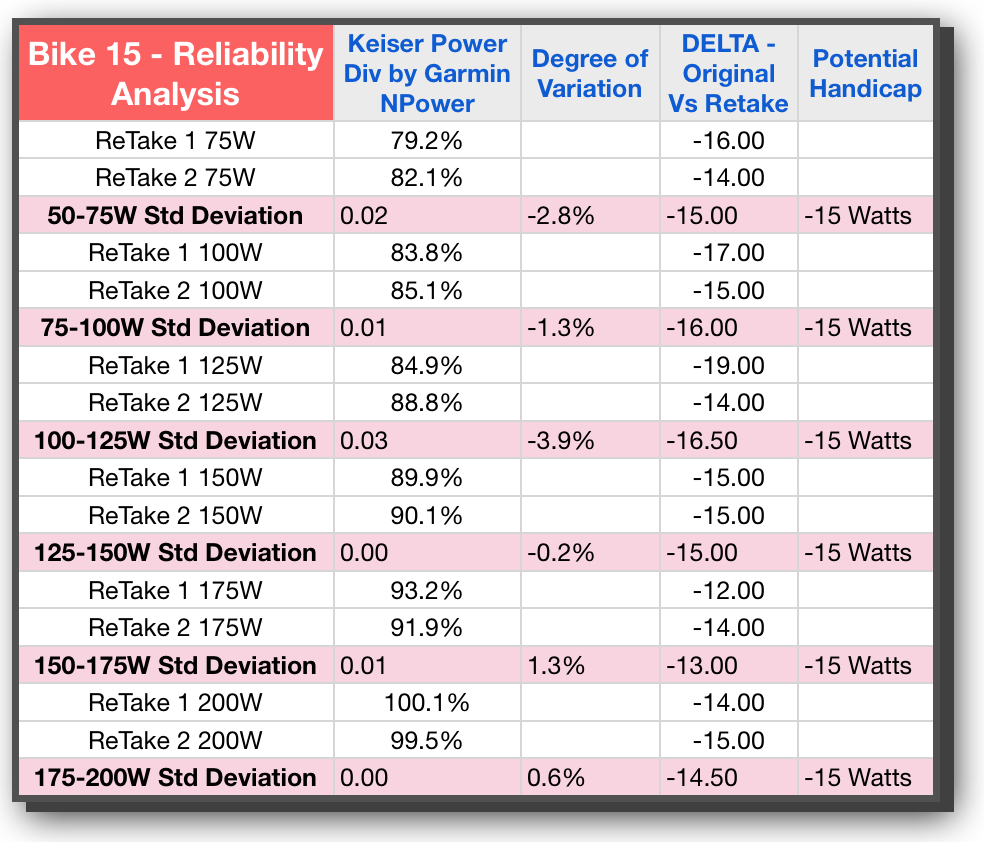
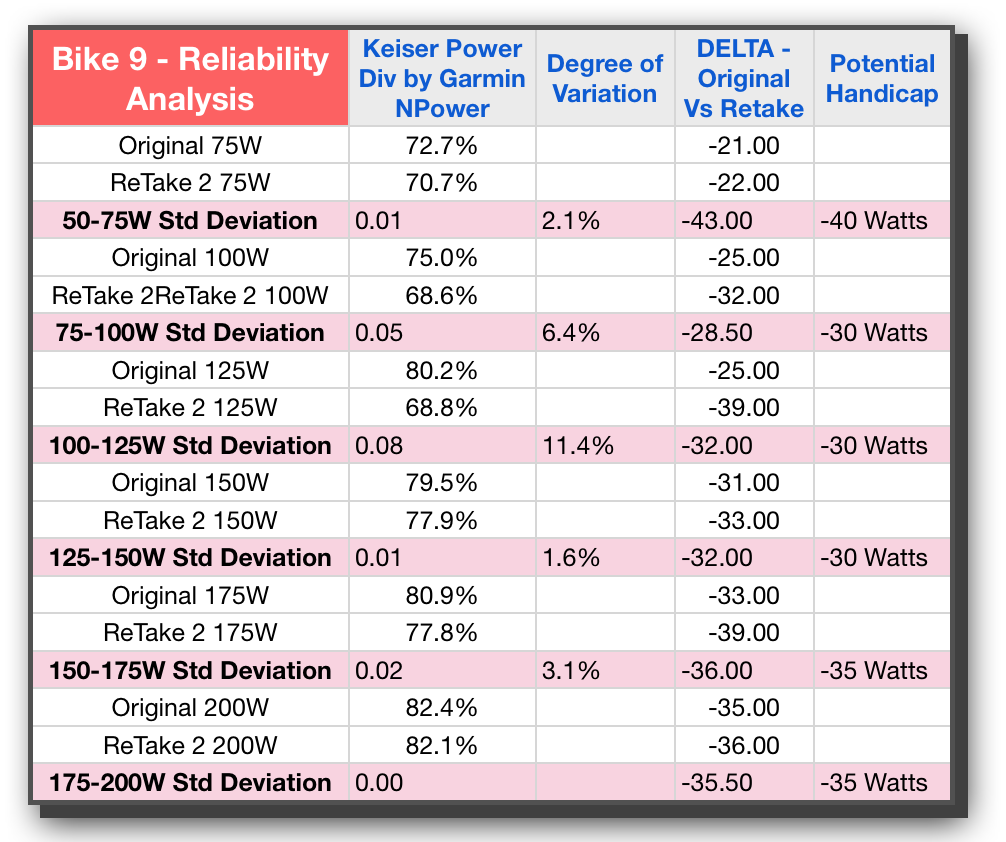
If we now take the difference between the first test and the next, we can get at how reliable the bike is between test sessions. This is the KEY metric for our purposes during this phase of the study; validating that each bike within itself is reliable. From a practical standpoint, we need the difference between tests to be low if our handicaps are going to be valid and useful from one class to the next. In looking at both Bike 15 and Bike 9 we see that these are indeed fairly low — an initial good sign — and there is only one instance where the difference is over 10%. That’s actually a lot less than I expected.
Column: DELTA Original vs Retake
This is a “pre-handicap” column — showing the exact wattage differences at each stage of power averages. While this will produce precise numbers with decimals, we know that a practical application of handicaps would likely need to be in increments of 5 so that the math is easier when performing that handicapping in ones head. We could also use this to send to an automated system if one was ever created that could account for bike variations in the software (an insightful feature I would create if I were the purveyor of such software).
we use this column to evaluate the exact differences and averages before we designate a specific handicap number.
This column is the one that also really shows the amount of variation from one bike to the next. On Bike 15 we are averaging in the teens with wattage differences, whereas Bike 9 is averaging in the 20s and 30s. That’s quite a spread.
Column: Potential Handicap
This column would represent the entire motivation and impetus for all of the time and energy being spent on this research. We want to handicap the bikes! If you’ve read my eBook on Power (if not, no worries an updated iBook is due out soon — shameless plug apologies ☺ ), you will know that Power is not linear in its progression. As such we can not just use one number as the handicap and apply that to all wattage levels. If you look at all 4 bikes, you will see, with the exception of Bike 15, the differences get bigger and bigger as the wattage level increases. This is the exponential nature of power and the reason why I propose a handicap value for every 25 or 50 watts.
How About Some Analysis
Up to now, we’ve only sprinkled the analysis or possible conclusions as I’ve described each column. However, in order to even think about drawing conclusions, we will need more data points than just 2. Lets’ show four more bikes so we can see if there are some patterns emerging when we have 6 total bikes and their retests — giving us a total of 12 tests or sets of data points to consider.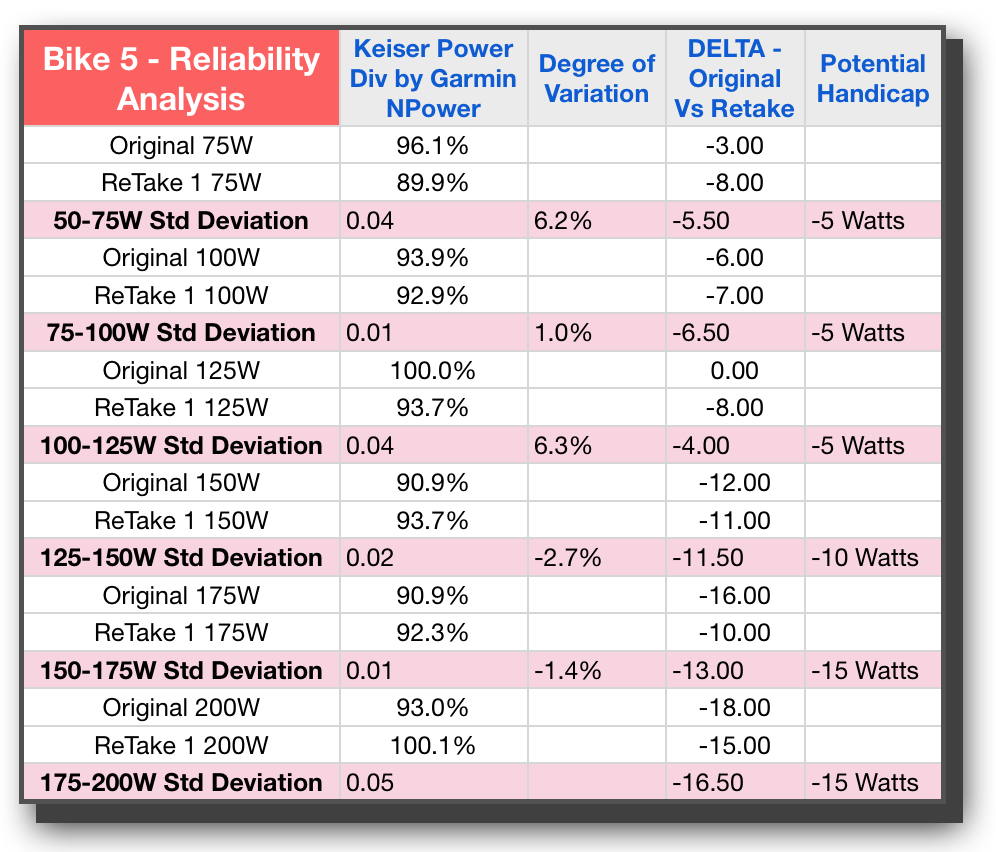
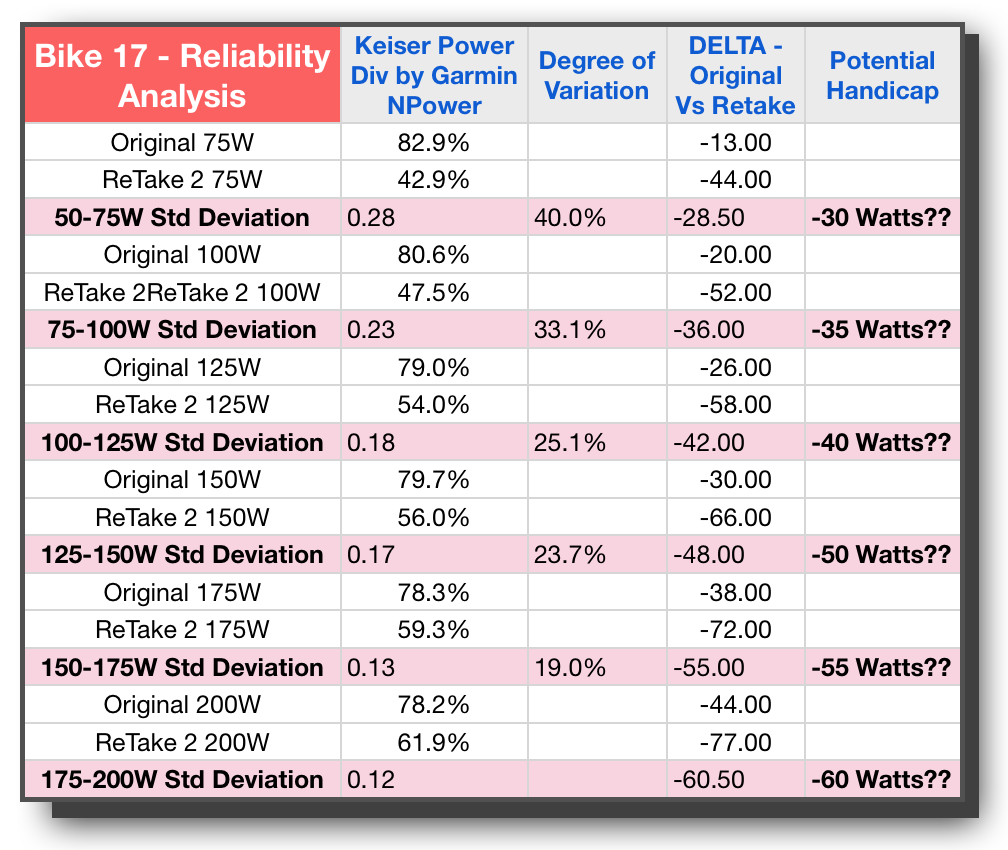
Looking at Bike 5 I’m feeling pretty good that it’s similar to #9, this time with all variation under 10% and the good power-like escalation of Potential Handicap wattage going up as a power curve would reflect. Taking a look at Bike #17 though, and I had to do a double take — WHAT?? or should I say “WAATTT!” The degree of variation is crazy. Not only that, even looking at it from a practical perspective, the Potential Handicap, aside from being huge in the 30 to 60 watt range, is simply not close to either of the trials in this study. While 30 Watts may indeed be the average between the two tests, with one being 13 and the other being 44, who knows if 30 will be too much or too little. In fact all of the stages are reflected as pretty wild for Bike 17.
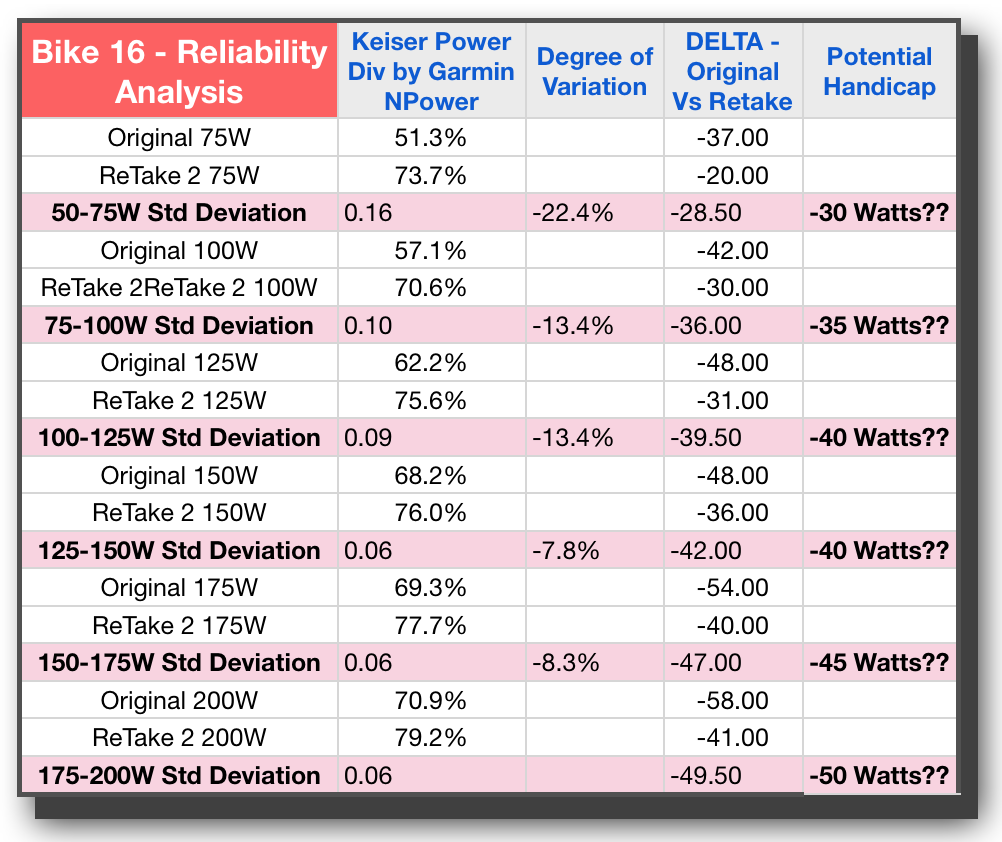
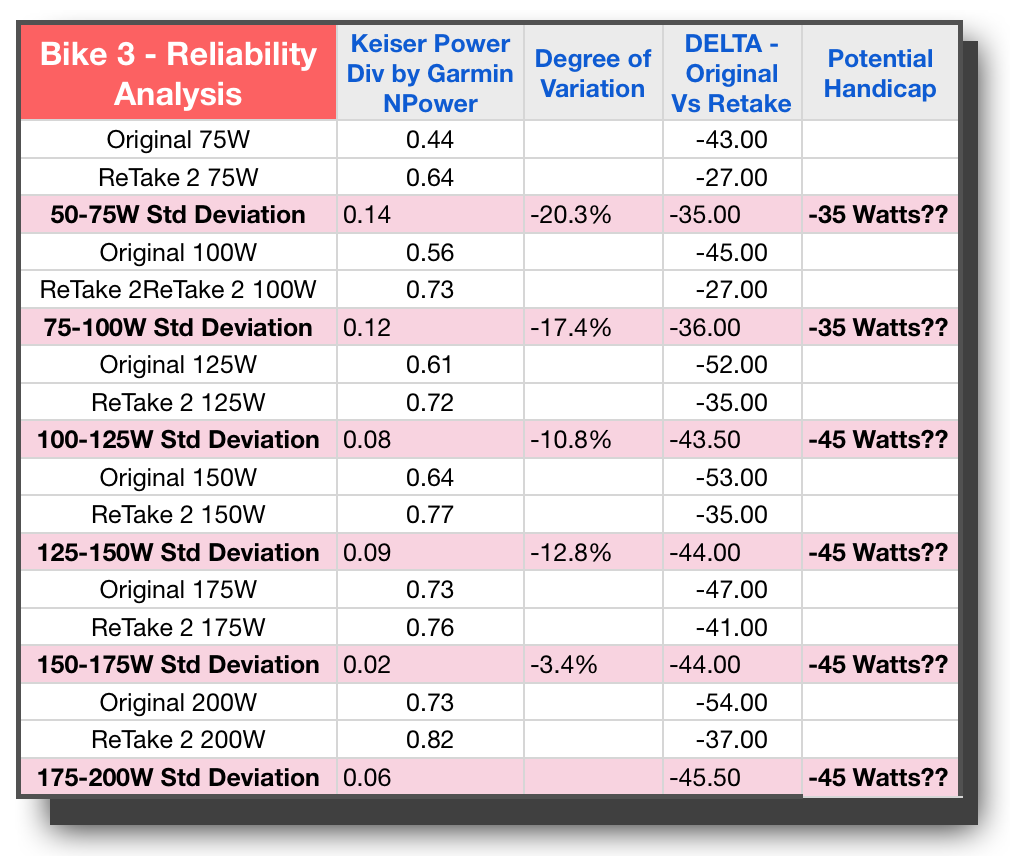
Unfortunately the bad news continues with Bike 16 and Bike 3. Both of these bikes have variations well above 10% and similar wide swings in Watts for the original delta between tests. In addition, we have bike #3 not demonstrating the proper power curve through the last 4 stages, but instead settling into one consistent difference in wattage.
Looking again specifically at these last 3 bikes, and there is no way I would be comfortable handicapping these bikes and expect it to be consistent. So all in all, we have 3 bikes that look like they would lend themselves to reliable handicaps, and three that do not. With a split decision like that, we are all but a hung jury here.
Since I recognized that I might be the problem — I am the only one conducting the tests – and while it stands to reason I would get better and more consistent over time not less, I did not want to rule that out. This data left me scratching my head more than anything else — more questions that need to be anwered. It was time to bring in bigger guns than I have.
The next blog will have another video where we brought in a professional statistician to help us get to the bottom of this.
- Think Like A Researcher – Blog Post #9 - August 5, 2021
- Power Training for Indoor Cycling Is Here - March 26, 2021
- Me & My Big Mouth - March 26, 2021
Gino,
I guess looking back testing seven bikes might have provided a tie breaker.
That said, I’m sure you laid it all out in the beginning. Please refresh my memory. What did you hope to get out of your testing? Were you just curious what the results would be?
I can see where the idea of handicapping might lead in terms of getting the most out of training indoors for your outdoor events.
I was hoping you were going to hit upon the ideal solution for us in the trenches that want use the power numbers more often but are afraid of the bike to bike inconsistencies.
I do admire your tenacity. I look forward to hearing what the statisticians have to say after they tell you to test one more bike. 😉
Thanks for your comment Chuck. Let me try and answer your questions.
First off, I have actually tested 14 different bikes – but I have only shared the data from the bikes I did RETESTING on. After I had about 10 bikes under my belt is when it occurred to me that I had better test the reliability of my method/equipment/etc. I had to be sure that I could reproduce the same results on the same bike or something was flawed beyond the ability to create a reliable handicap.
While I am as curious as a cat when it comes to anything related to training, I did not spend this time and energy on pure academic interest. From the very first session, my desire was to find a way to calibrate the bikes and to share that with all Keiser m3 owners. I’ve felt like that should be achievable for a couple of years now. So yes – a solution for all of you (US) “in the trenches” is exactly what I wanted to arrive at.
Finally, the post this week and next will be from my time with the statistician. She was UBER methodical and required I test three bikes on three different occurrences in 3 different sequences and she was present for each test. Those 9 additional tests will be forthcoming. How’s that for a teaser 🙂