Time To Dig In
So we’ve painstakingly done everything possible to setup and prepare our methods for a solid research project — at least as solid as any “non-university” research setting can hope for. We’ve not only established a consistent protocol for conducting the tests, but we’ve also made sure to not do too many in any one day, nor to use different testers to eliminate potential influences to our results.
Once we executed these tests on about a dozen bikes, I wanted to start to analyze the data, and that’s when it occurred to me that we needed to make sure that the numbers I was about to analyze were reliable and repeatable from bike to bike. My last post demonstrated the process of re-testing to insure that very thing. After doing retests on about 6 of the 12 bikes, it is now finally time to review the data and see just what is what.
Let’s Start With The First 2 Bikes
Each day I tested only 2 bikes — to make sure I was fresh each time. So naturally, my first peak at the numbers (and I try not to look at them until I am well into the research so that initial impressions do not subconsciously alter my performance as more tests are conducted) came after these first 2 retests. Remember, I’m into the research project a couple of months now without letting myself “have a taste” — that’s pretty tough for a data-geek like me ☺. So below you will see the first two bikes retested. Let’s go over the columns so we can understand what we are looking at.
1st Keiser m3 Indoor Cycling bike with power to be tested & retested.
2nd Keiser m3 Indoor Cycling Power bike tested with the Garmin Vector Pedals
The first column represents the 25 Watt stages that were used to get the average power numbers from. These were “settled into” for 2 to 3 minutes at each of these stages. More specifically I used the Keiser console to establish a steady wattage level during each stage, and then once the 2.5 minutes were up, I stopped the keiser to get the true average (which typically was within 5 watts of the target) and we also lapped the Garmin so it would later give us the average or “Normalized Power” (NPower is how I have referred to it on the table) from the Garmin Vector Power Pedals.
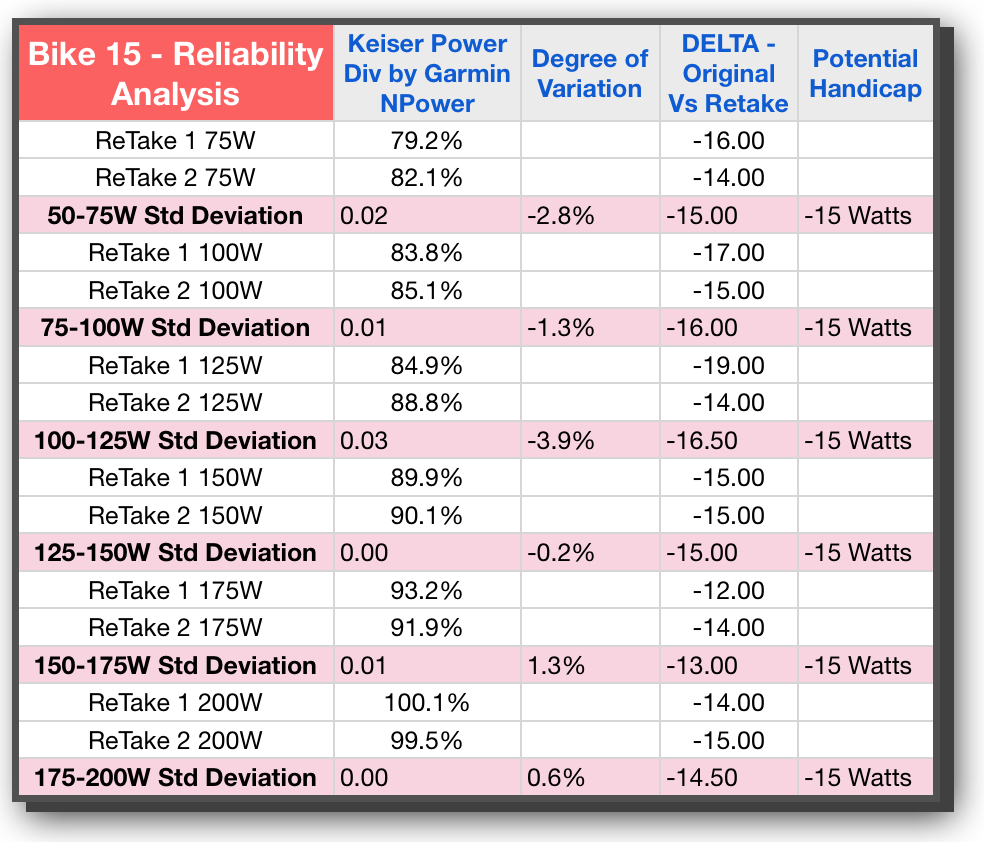
Column: Keiser Power Div by Garmin NPower
By dividing the calculated power of the bike by the measured power from the Vector power pedals, we will see by percentage just how close they are to each other. Remember, we are not concerned about pure accuracy per se — we know the calculated power is going to be inaccurate by its nature — we simply want to know how much it is off, and if that amount is reliable every time re ride that bike. Each percentage is a reflection of both bikes at a specific wattage on one test.
Column: Degree of Variation
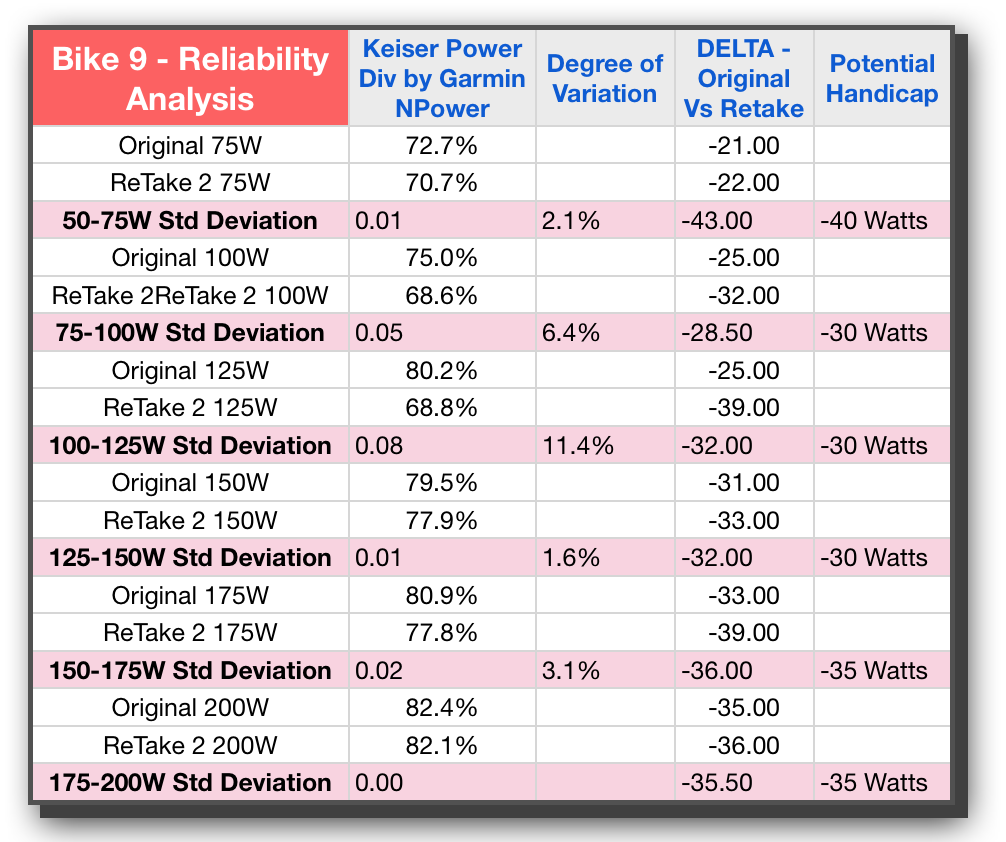
If we now take the difference between the first test and the next, we can get at how reliable the bike is between test sessions. This is the KEY metric for our purposes during this phase of the study; validating that each bike within itself is reliable. From a practical standpoint, we need the difference between tests to be low if our handicaps are going to be valid and useful from one class to the next. In looking at both Bike 15 and Bike 9 we see that these are indeed fairly low — an initial good sign — and there is only one instance where the difference is over 10%. That’s actually a lot less than I expected.
Column: DELTA Original vs Retake
This is a “pre-handicap” column — showing the exact wattage differences at each stage of power averages. While this will produce precise numbers with decimals, we know that a practical application of handicaps would likely need to be in increments of 5 so that the math is easier when performing that handicapping in ones head. We could also use this to send to an automated system if one was ever created that could account for bike variations in the software (an insightful feature I would create if I were the purveyor of such software).
we use this column to evaluate the exact differences and averages before we designate a specific handicap number.
This column is the one that also really shows the amount of variation from one bike to the next. On Bike 15 we are averaging in the teens with wattage differences, whereas Bike 9 is averaging in the 20s and 30s. That’s quite a spread.
Column: Potential Handicap
This column would represent the entire motivation and impetus for all of the time and energy being spent on this research. We want to handicap the bikes! If you’ve read my eBook on Power (if not, no worries an updated iBook is due out soon — shameless plug apologies ☺ ), you will know that Power is not linear in its progression. As such we can not just use one number as the handicap and apply that to all wattage levels. If you look at all 4 bikes, you will see, with the exception of Bike 15, the differences get bigger and bigger as the wattage level increases. This is the exponential nature of power and the reason why I propose a handicap value for every 25 or 50 watts.
How About Some Analysis
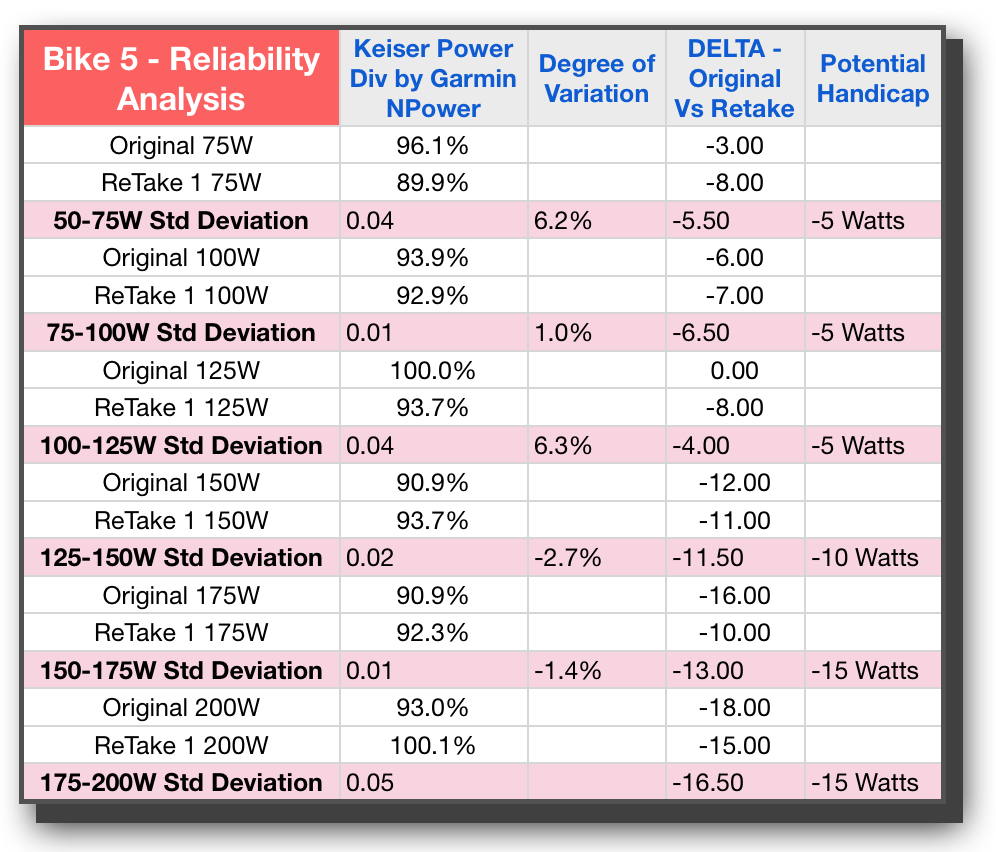
Up to now, we’ve only sprinkled the analysis or possible conclusions as I’ve described each column. However, in order to even think about drawing conclusions, we will need more data points than just 2. Lets’ show four more bikes so we can see if there are some patterns emerging when we have 6 total bikes and their retests — giving us a total of 12 tests or sets of data points to consider.
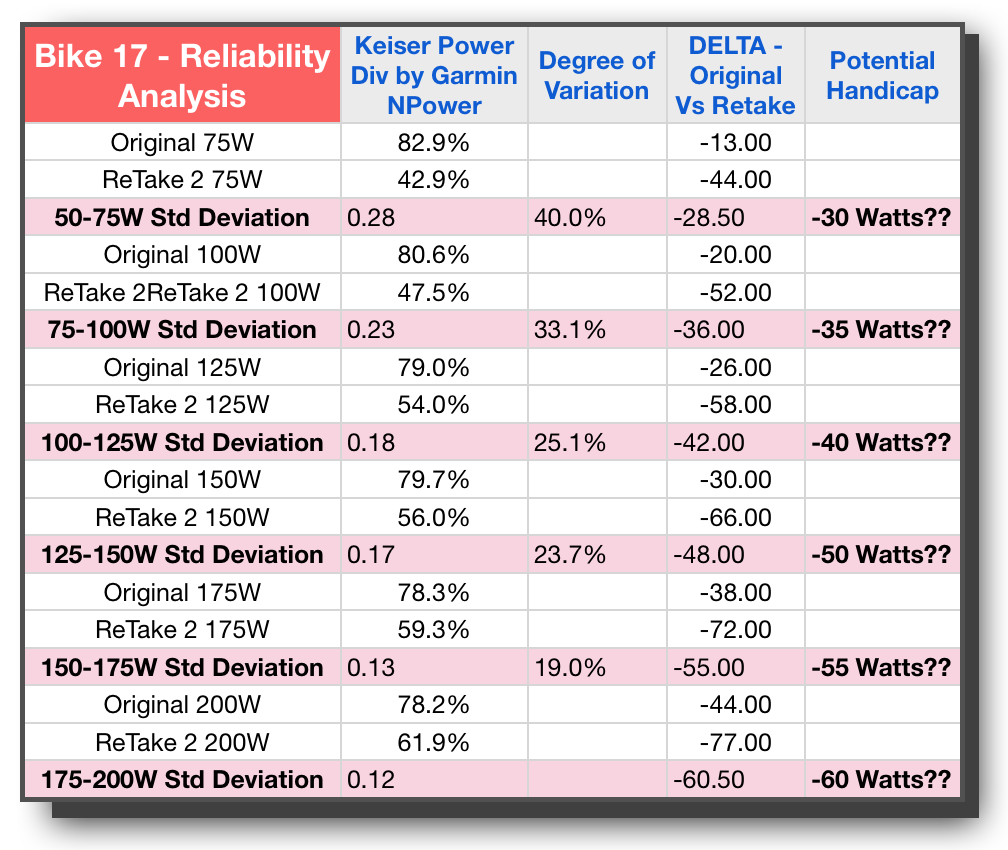
Looking at Bike 5 I’m feeling pretty good that it’s similar to #9, this time with all variation under 10% and the good power-like escalation of Potential Handicap wattage going up as a power curve would reflect. Taking a look at Bike #17 though, and I had to do a double take — WHAT?? or should I say “WAATTT!” The degree of variation is crazy. Not only that, even looking at it from a practical perspective, the Potential Handicap, aside from being huge in the 30 to 60 watt range, is simply not close to either of the trials in this study. While 30 Watts may indeed be the average between the two tests, with one being 13 and the other being 44, who knows if 30 will be too much or too little. In fact all of the stages are reflected as pretty wild for Bike 17.
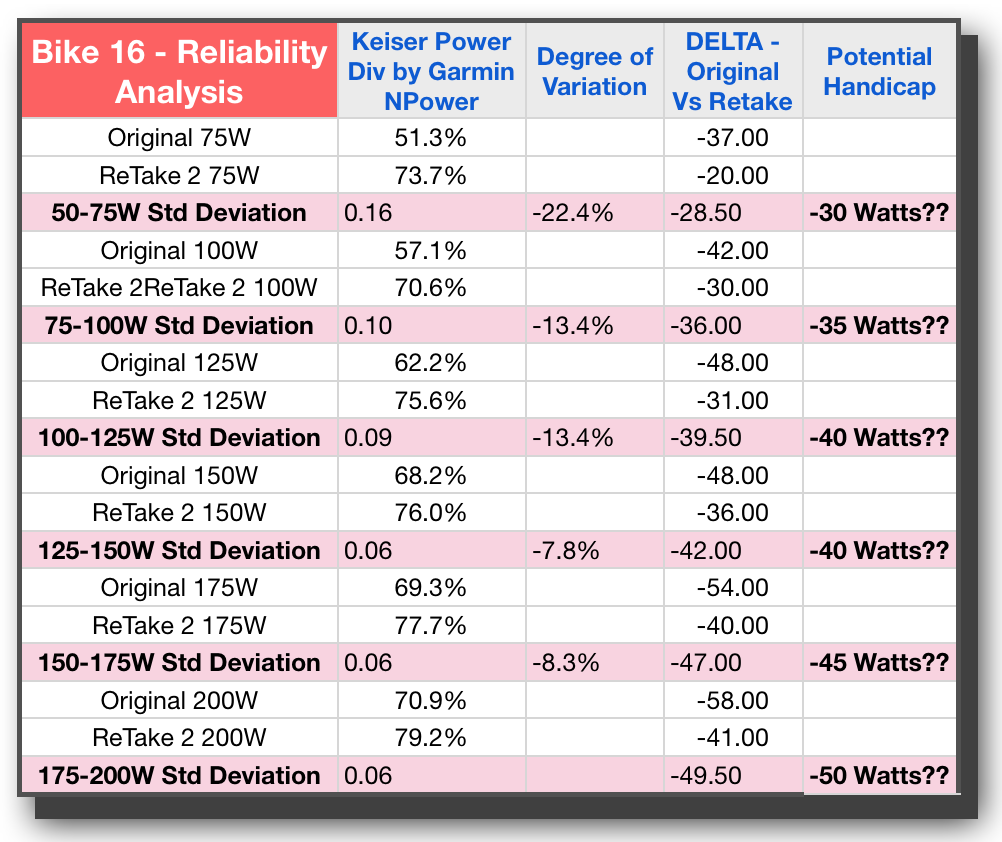
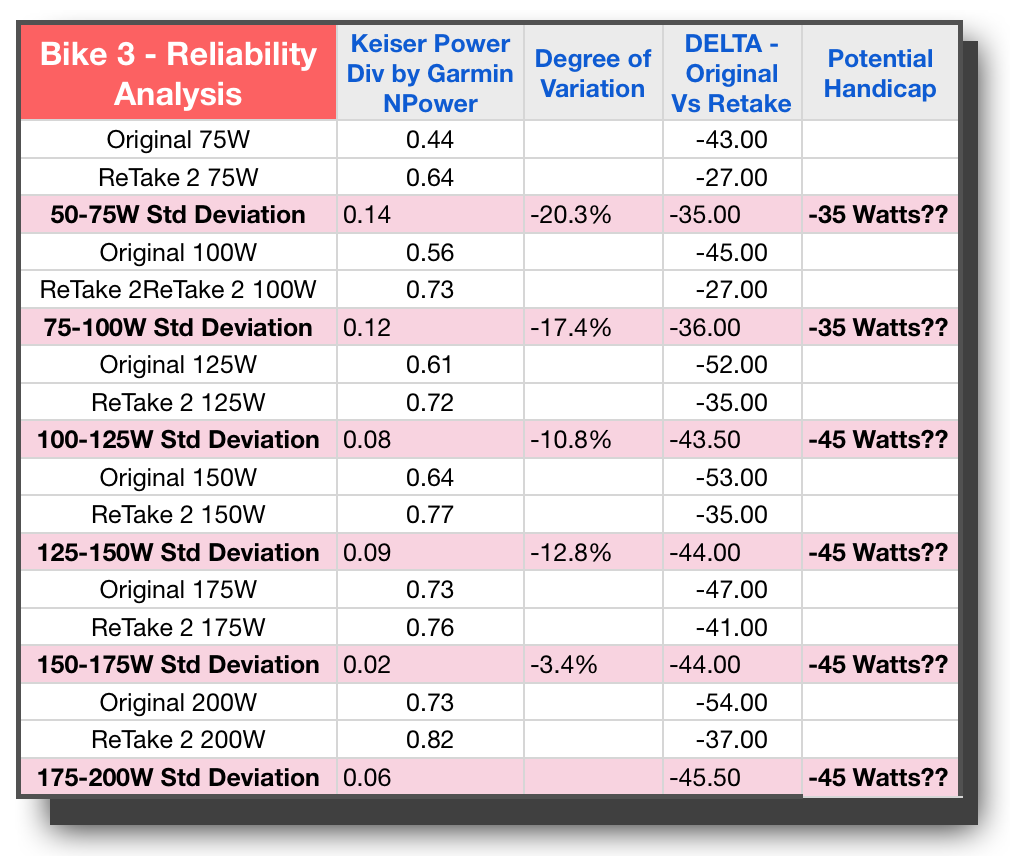
Unfortunately the bad news continues with Bike 16 and Bike 3. Both of these bikes have variations well above 10% and similar wide swings in Watts for the original delta between tests. In addition, we have bike #3 not demonstrating the proper power curve through the last 4 stages, but instead settling into one consistent difference in wattage.
Looking again specifically at these last 3 bikes, and there is no way I would be comfortable handicapping these bikes and expect it to be consistent. So all in all, we have 3 bikes that look like they would lend themselves to reliable handicaps, and three that do not. With a split decision like that, we are all but a hung jury here.
Since I recognized that I might be the problem — I am the only one conducting the tests – and while it stands to reason I would get better and more consistent over time not less, I did not want to rule that out. This data left me scratching my head more than anything else — more questions that need to be anwered. It was time to bring in bigger guns than I have.
The next blog will have another video where we brought in a professional statistician to help us get to the bottom of this.
Making sure this process is repeatable with each bike tested is essential to our objectives.
Let’s recap what we’ve done so far in our video blog series:
1. We have introduced the whys and wherefores of this Indoor Cycling Power research project
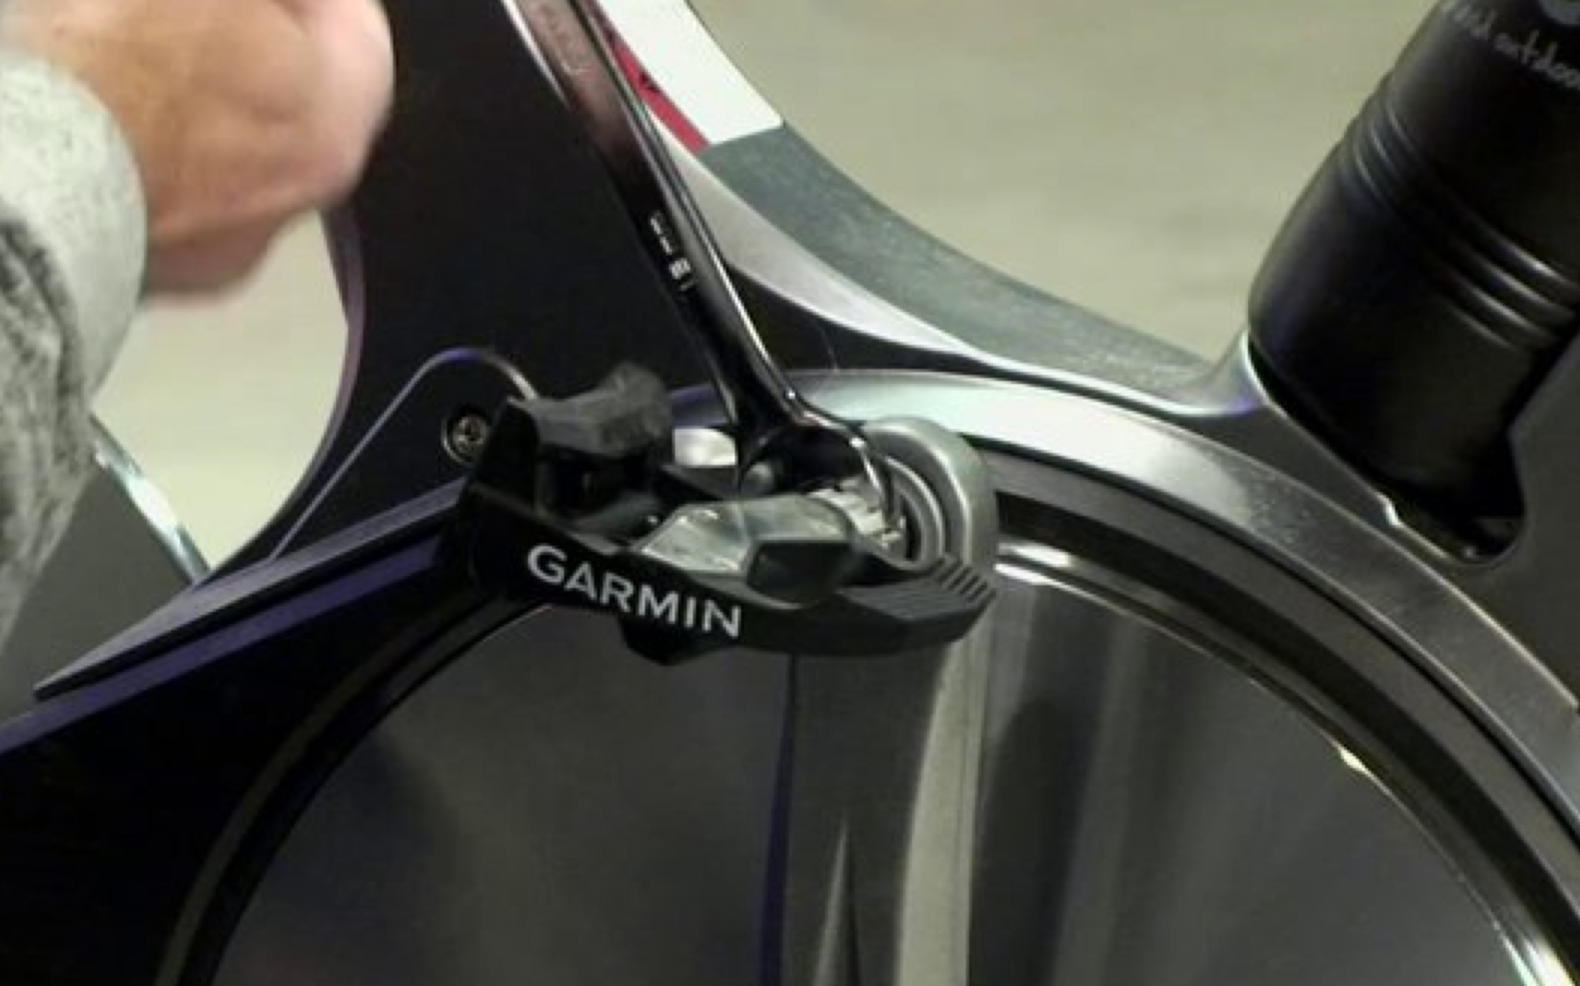
2. We’ve shown exactly how the Garmin Vector pedals get mounted to the Keiser m3 indoor cycle bike
3. We’ve demonstrated from start to finish, the precise protocol used in conducting repeatable tests on each bike
4. Last week we stepped through the process for getting the data from both the Garmin bike computer and the Keiser m3 console (manually recorded) put into the a consolidated spread sheet.
Accuracy & Reliability Are Two Different Things
This week we move into the steps required to begin validating the reliability of our equipment and/or our process. This is as crucial a consideration as the pure accuracy of the data. If we can’t confirm that our process of measuring power is consistent on any one given bike from one day to the next, how can we expect to handicap the bike for accuracy with a number or even series of numbers for different wattage levels since an unrepeatable test would mean this handicap would not be valid from one day to the next.
Consider the frustration of weighing yourself each day on a scale that can not show you 50 lbs from a 50lb weight from day to day. On some days you’ll be depressed while others you’ll be “woo hooing” all the while your weight has stayed the same. It’s an absolute critical component of our findings; to know what we are doing is repeatable and reliable. If it isn’t, we need to consider if the process is changing and causing the inconsistencies, or if the equipment is doing so. While I have tried to be more than methodical about every aspect of this process from pedal calibration to bike test execution, I will not rule out tester error or inconsistency for the moment. Let’s just first see how our numbers turn out before we decide which factor to consider (test process, or equipment variability).
Coach Gino Explains Why Validation & Reliability Are Important
The 2 video segments that make up this post are both quite short. The first one describes in detail how to unmounts the Vector Power pedals in order to use them on a second bike. It is important that we don’t just leave the pedals on and do multiple tests on the same bike. This would not tell us if that bike will be reliable one day to the next. We must first test other bikes, and then come back to bikes we’ve tested.
The second video segment is showing one complete test again (like our 2nd video), only this time on one of the bikes already tested from a previous session.
Not practicing the hand-off – but what comes next…
One of the many benefits of riding and training indoors, is not worrying about crashing and ending up on your head. So we practice our; pedaling technique, or Sprint form or whatever, without thinking about balancing or where we're going.
Now if we were riding our road bikes on trainers we could also practice reaching down, grabbing a bottle, taking a drink and then returning it safely into the cage. Not an easy task for many new (and a few old) outdoor cyclists.
Bicycle Safety Tip
2012 Tour de France winner Bradley Wiggins pictured above/right may be an awesome cyclist with phenomenal bike handling skills. But he's not demonstrating proper hand position with one hand off the bars. The correct (safe) position for his left hand is on the cross bar, very close to the center / stem. Why not out at the end where he has it in the picture?
It's a matter of leverage. The further you hand is, away from the center/pivot, the easier it is to turn the bars. Without your other hand to counteract the force, riders with just one hand, on the outer end of the bars, tend to ride erratically = not in a straight line = dangerous.
Speaking of proper hand positions > I discovered this video while researching this article. Nothing to do with cycling, but it will get your heart rate up when you watch it 🙂
In celebration of today being the Super Bowl (the biggest sporting event in North America) we played drinking games. Not the typical; take a shot whenever an announcer uses some predictable cliche – that comes later today.
In class we played a different type of drinking game.
Although we're not on real bicycles, there's still a valuable technique we can safely practice during class; drinking at a high level of effort > @ or over FTP/Threshold/AT/Lt whatever you call it. More specifically; learning to regulate your breathing so you don't choke, launch into a coughing fit, swerve over and ultimately take down your riding buddy – or end up in the ditch.
NOT drinking enough during a long ride is the sure path to early fatigue. During a hard group ride there may not be a lot of breaks where you can recover and hydrate easily. So today we only drank during hard efforts, not during the recoveries when you would normally towel off and take a sip.
The first Sunday of each month is an FTP Assessment. Here's my class.
Class length 75 minutes + Cool Down
Warm Up — 10 minutes. 5 minutes of gradual increases in wattage. During the second 5 mins. we’re finding the wattage where everyone is first noticing a change in breathing; VT1 / Aerobic Threshold = the top of the Recover Zone. This establishes a rough understanding of a base wattage that we use throughout the rest of class.
3 x 30 sec. Hard / 30 sec. Easy – Openers to AT/LT. I cue these by first having everyone find the amount of load @ 70 RPM that has them feeling they should (not just could) come out of the saddle. The 30 sec. Hard is then simply accelerating to 90+ RPM which results in some pretty impressive power numbers. The 30 sec. Easy is back to 70 RPM — many will stand during the Easy portion.
1 minute rest – I encourage riders to focus on their recovery. Once they feel calm in their breathing, bring back the Base level work wattage.
3 min. Hard Effort — Here’s a “Best Effort” to establish a benchmark PTP Personal Threshold Power (top of the Perform Zone) or ride at 110% of FTP if known. It’s very helpful to riders to have that understanding of their personal upper wattage number. The “Best Effort” Threshold # + the Base Threshold # we found earlier form the three Power working zones I use in class.
2 min. Rest
3 x 1 min. Hard Effort x 1 min. Rest. These should be above the 3 minute average wattage.
3 min. Rest
20 min. TT / FTP Assessment effort – Quickly establish the average wattage at or near the 3 min. Interval. > Stage Button and then maintain. You may want to offer slight changes in cadence & load, while keeping wattage = to the initially established watts #. I was off the bike at the 10 min. to go, coaching, encouraging and then just watching them with a big smile on my face. This is a great group and they looked incredible — I’m so in my element with these classes
5 min. Rest
Base Wattage (aerobic) flat road to finish — use these time to congratulate everyone and give tell them a bit about what you have planned for them next week.
In keeping with the Nonlinear Periodization training prescribed by Coach Troy, today was a combination day of strength (climbing) and building endurance @ Threshold HR/Watts.
Experienced cyclists know what a real climb feels like. While Indoor Cycling may get close, nothing can truly replicate climbing outdoors, on a road bike, over a long, steep climb. This morning's profile includes 4 long climbing efforts; 2 x 8 min., 1 x 10 min. and the final 11.5 min. to the summit. The final 2:48 features “The Wall” – an all out effort paced to my favorite Black Sabbath track Paranoid. Only available from iTunes.
Long duration efforts, at reduced pedal cadences, offer time to work on other components of efficient cycling; pedaling technique, body position and breathing control. Today we focused on what I call disruptive breathing, i.e. consciously breaking each rider's innate breathing rhythm, for the purpose of bringing focus to each breath and making each as complete as possible.[wlm_private ‘PRO-Platinum|PRO-Monthly|PRO-Gratis|PRO-Seasonal|Platinum-trial|Monthly-trial|PRO-Military|30-Days-of-PRO|90 Day PRO|Stages-Instructor|Schwinn-Instructor|Instructor-Bonus|28 Day Challenge']
There's some interesting literature about this. Here's an excerpt from one article.
WHAT CAN YOU DO?
First, practice deep breathing. With a normal breath we generally use only 10 to 15% of our lungs capacity. And during exercise, we tend to increase the rate, not the depth of our breathing. Although deep breathing is more work, and uses a bit more energy, the pay off can be that 1 – 2% edge in a competitive situation. Here are 4 changes you might consider:
Exhale more completely. After a more complete expiration, it is easier to take a deep breath. The usual rhythm is exhale to a count of 3 followed by inhaling to a count of 2.
Belly breathe. As you concentrate on deep breathing, you will push your diaphragm down and thus the abdominal contents out. If you are doing it correctly, your abs will expand more than your chest.
Widen your hand position. A 2 cm wider hand position will open up your chest and decrease the difficulty of drawing in a deep breath.
Synchronize your breathing. Try to synchronize your respiratory rhythm to that of your pedal cadence. Remember the 3:2 ratio of exhale to inhale.
I cued variations on all four of these concepts throughout class.
Quick Tip: years ago I learned first hand how widening your hand position can improve your O2 uptake / power while cycling. My first road bike (Schwinn Paramount) came with somewhat narrow handlebars. Not knowing anything different, I rode with them for about a year. Until during one group ride one of the “Old Dogs” riding next to me asked; “why do ride with such narrow bars?” Not having a good answer, I just shrugged my shoulders and said they came with the bike. Taking the hint, that week I bought new bars in the width recommended by my team's sponsor/bike store. They made an amazing difference in my ability to breath and with wider width bars, I felt better in control of the bicycle.
Warm Up — 10 minutes. 5 minutes of gradual increases in wattage. During the second 5 mins. we’re finding the wattage where everyone is first noticing a change in breathing; VT1 / Aerobic Threshold = the top of the Recover Zone. This establishes a rough understanding of a base wattage that we use throughout the rest of class.
3 x 30 sec. Hard / 30 sec. Easy – Times Like These Openers to AT/LT. I cue these by first having everyone find the amount of load @ 70 RPM that has them feeling they should (not just could) come out of the saddle. The 30 sec. Hard is then simply accelerating to 90+ RPM which results in some pretty impressive power numbers. The 30 sec. Easy is back to 70 RPM — many will stand and walk during the Easy portion.
2:35 rest – The Best Is Yet To Come ~ Tony Bennett. I encourage riders to focus on their recovery. Once they feel calm in their breathing, bring back the Base level work wattage. I'm talking/motivating everyone about how important it will be for their “Best Effort” to be a BEST EFFORT!
3 min. Hard Effort — 4:03 Race Against Time ~ U2. Here’s the “Best Effort” to establish a benchmark PTP Personal Threshold Power (top of the Perform Zone) or ride at 110% of FTP if known. Song is @ 70 RPM – which is perfect to establish PTP at a climbing cadence. Have everyone find the tempo and add gears > STAGE Button about one minute in and I coach them off the bike during this hard effort.
1:16 Rest – Quick drink before we start Climb #1
7:58 Climb – Bermuda ~ Fluke. Right back to 70 RPM and have riders quickly establish their wattage to 10%-15% below the 3 min. “Best Effort” power. > STAGE Button and then maintain this average until the end. You may want to offer slight changes in cadence & load, while keeping wattage = to the initially established watts #.
4 min. Rest – Delirious ~ Prince
8:02 Climb – Tribal Force ~ Higher cadence @ 84RPM with the same wattage. This moves more of the work to the aerobic system and is a little less stressful on everyone's legs.
4 min. Rest – White Flag ~ Dido
10:03 Climb – Final Frontier ~ Juno Reactor. Back to 70 RPM and encourage riders quickly get as close to their 3 min. “Best Effort” as possible and sustain it to the summit. Many of your athletes are strongest now – help them take advantage of their full strength here!
2 Min. Rest – Last Impression
Final 11:33 Climb – Starts with Come together ~ Joe Cocker at 83RPM. This is more of a tempo effort in the middle of the Performance Zone / between the two power thresholds. Continues with Time Will Crawl ~ Bowie as the road steepens and pedal speeds slow to 63RPM > keeping the same watts, with a bigger gear, as we approach the the final challenge of the day…
The Wall – 2:48 Paranoid ~ Black Sabbath. The beauty of riding magnetic cycles is how simply accelerating a big gear = a huge increase in work. Those big pedals accelerating from 63RPM to over 80RPM should produce the biggest #s of the ride and at less than 3 minutes this should be achievable by everyone 🙂
Base Wattage (aerobic) flat road to finish — use these time to congratulate everyone and give tell them a bit about what you have planned for them next week.
It's a fact of life for all of us teaching power based classes; inconsistency in the watts readings between cycles. Some brands seem to be better than others. Certain bikes seem to be always right, while others are never even close. Calibration is done more frequently by some clubs… or not at all – or the cycles you ride don't offer that option.
This isn't just about us either. Our riders want to feel confident in what they are seeing on their monitors. If they don't believe what they're seeing, they'll soon come to ignore it or worse – ignore you and your coaching.
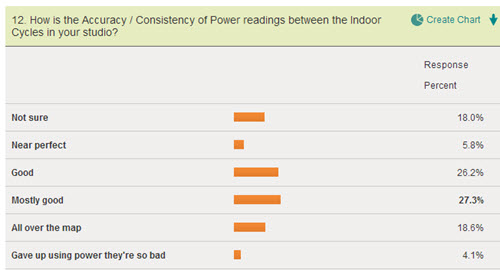
Here's a screen shot from the Indoor Cycle With Power Instructor Survey – click here to add your experiences.
As you can see, only 32% of Instructors rate their cycles as having Near Perfect or Good Accuracy/Consistency. Those of you in the other 68% have a real challenge, making effective use of the tools we're provided and teaching an awesome class!
So here's what to do about it, three simple steps:
Step # 1 – Acceptance of the problem
I actually found myself getting defensive whenever someone made a negative comment to the effect of; “the power meters on these bike aren't accurate.” I'd start making excuses, or questioning the person with; “inconsistent compared to what”? This question, it turns out, does have some value. It's often important for Step #2 to understand; are they are comparing the cycles in your studio to their road bike power meter, or is their complaint focused on inconsistencies between the individual cycles in the room?
If you don't catch yourself, excuses may slip into complaining about management's lack of over-site (not doing regular calibration) or lament that no one asked you which Indoor Cycles to purchase. It you only had XYZ brand this wouldn't be a problem 🙁
This is all out of your control – so just accept “what is”, smile and deal with it.
Step #2 – Communicate your acceptance
To your cyclist you may say; “Yes I know that the power you're seeing doesn't compare with the $2,000.00 Quraq power meter on your road bike.” “There are a multitude of reasons why you're seeing different watts readings… your fit is different, the crank arms are longer/shorter, etc…” Or you might add; “has it been a while since you were riding consistently?” “Could your fitness have changed”? In any event I feel you just need to communicate your understanding that there is a difference.
More importantly, to your class; these power meters are an awesome tool to help you improve your fitness. We are seeing some variation between cycles, making it difficult to compare wattage numbers between workouts and/or other individual bikes in the room. What's important is today's numbers. After all, yesterday's or last Tuesday's ride is in the past… let's focus on today's effort!
Step #3 – Coach the solution
In the survey we're running, I ask the question; Do you conduct any type of assessment during class, to help your students understand or identify a benchmark watts PTP (Personal Threshold Power)? If so please briefly describe what you do and how you teach it.
Yes I know it was a bit of a “leading question”. But identifying a benchmark watts/power # is the solution to inconsistencies between the Indoor Cycle's power meters in your class.
The question was open-ended and drew a number of great responses:
Because the power measurements are so different (inaccurate) among the bikes in the studio I do a 7 minute PPT at the beginning of every class to give each member a usable number for the specific bike they are using.
I need to do a “mini” threshold test at the beginning of every class to get participants “dialed in” because the power readings are so inconsistent from bike to bike.
Yes.. A 5min MAP test
I'm not aware of any “approved” protocol for a benchmark / PTP effort (I call them “Best Efforts”). Depending on your demographic you want these to be 3-7 minutes long – mine are typically four minutes long. I do feel that you and your athletes will benefit from consistency. I do these in every class. If you're a Life Time Fitness Instructor these fit very nicely into the new EDGE Cycling format.
Warm Up — 10 minutes. 5 minutes of gradual increases in wattage. During the second 5 mins. we’re finding the wattage where everyone is first noticing a change in breathing; VT1 / Aerobic Threshold = the top of the Recover Zone shown above. This establishes a rough understanding of a base wattage that we use throughout the rest of class.
3 x 30 sec. Hard / 30 sec. Easy – Openers to AT/LT. I cue these by first having everyone find the amount of load @ 70 RPM that has them feeling they should (not just could) come out of the saddle. The 30 sec. Hard is then simply accelerating to 90+ RPM which results in some pretty impressive power numbers. The 30 sec. Easy is back to 70 RPM — many will stand during the Easy portion.
2 minutes rest – I encourage riders to focus on their recovery. Once they feel calm in their breathing, bring back the Base level work wattage.
4 min Best Effort – to establish a benchmark PTP Personal Threshold Power (top of the Perform Zone) or ride at 110% of FTP if known. It’s very helpful to riders to have that understanding of their personal upper wattage number. The “Best Effort” Threshold # + the Base Threshold # we found earlier form the three Power working zones I use in class.
– 1 min. build at preferred cadence (suggested as 85-95 rpm) — press the Stage Button to reset the averages.
– 4 min. “Best Effort” This should hurt, but be do-able. I ask everyone to observe their average at the end
Hi John,
I have a friend who will be general manager of a new inn & spa here in {State}. They want to purchase bikes and have asked me to look at the proposal. I don't know what I would recommend – what's your opinion on the best brand/models to consider and how can I best put it out to the ICI/PRO community?
Your thoughts?
Thank you!
I normally respond with a few suggestions and/or followup questions. But his last question got me thinking – how can I best put it out to the ICI/PRO community?
Yes, I've ridden everything on the market and have talked with dozens of Studio Owners and Instructors, so I can offer educated suggestions. But beyond my own personal experiences, wouldn't it make sense to learn from the thousands of other Instructors and hundreds of Studio Owners, who own and teach on these new bikes?
And then make some of that collective knowledge available to prospective purchasers, of the growing list of Indoor Cycles with Power?
So we created a survey and sent it out to a few Instructors, Studio Owners and each of the IC brands for comments. It quickly became apparent that we would need to divide the questions between two surveys, to reflect the different perspectives between Instructors and Studio Owners & Managers.
You can find the proper survey for you here:
Indoor Cycle With Power Owner's Survey – Click Here
And…
Indoor Cycle With Power Instructor's Survey – Click Here
We tried to keep each survey as brief as possible, but there's a lot to learn here 🙂
If you teach at multiple locations, each with a different IC with Power, please feel free to complete a separate survey for each location. This will run until the end of January. If you need an early peek sooner than that – Contact us.