The Power of 3 – “”My Body Tells Me “NO” But I Won't Quit Cuz I Want More”
“Turn The Levels” by DJ Lobersterdust
“Part of Me” by Katy Perry
“My Body” by Young the Giant
There has been a lot of talk lately about the proper range of RPM (Revolutions Per Minute) in indoor cycling classes. The general range that most indoor cycling certifications recommend is 60-110rpm. That doesn’t mean that going a little faster or slower is going immediately cause injury, it means that this range can be ridden effectively by most people in the population.
When I started teaching with power, about 2 years ago, the first thing I discovered was how a high RPM and lower resistance could elevate the HR (Heart Rate) as well as RPE (Rate of Perceived Exertion) without the associated increase in power or output. The “fast spinners”, who for years were considered the “stars” of class, were shocked at how low their power numbers were. Many of them complained that the power meters must not be working properly or were broken. I tried to calm them and explained that they were beautifully athletic riders but they may have never trained with the appropriate resistance while riding at a high cadence. I asked them to be patient and to use this new found knowledge and tool to help them reach fitness levels they had only dreamed of. By finding their most efficient cadence, that RPM where the body can produce the most power at the lowest HR or RPE, and progressively increasing cadence and maintaining power, over time, many of these riders are now able to ride at a fast cadence and maintain a high power output.
Interval sets like the one below are how I coach riders to slowly but steadily increase their most efficient cadence over time.
3 song harmonically mixed track, to download Right Click > Save As / Save Target As to download. Open in iTunes and then you'll see this in your Spotify Local File folder.
Do you remember the old days of indoor cycling when it felt like the only cues instructors knew were “turn it to the right” or “add more resistance” or “turn it up”? It seemed like these were the only cues they were ever taught and eventually everyone in class was doing a phantom turn because there legs, lungs and heart couldn't handle any more intensity. Well, those “good old days” are what helped me dream up this “No Left Turn” set. The goal of this set is to finish every interval with a higher average wattage than the previous interval and to “turn it to the right” for every new interval. With the proper “anchoring” of time and effort and pacing this set can be successfully completed. The timing of this set consists of 3 intervals of 3 minutes with 1 minute recover after each, followed by 3 intervals of 2 minutes with 1 minute recovery after each, followed by 3 intervals of 1 minute with 30 seconds recovery after each. The first interval of each set should be ridden seated with a cadence range of 80-110 rpm, the second interval of each set should be ridden seated with a cadence range of 60-80 rpm and the third interval of each set should be ridden standing with a cadence above 60 rpm.
After a proper warm-up, explain the set to your class, you can even ask them if the remember the days of instructors asking them to turn it up 20 or more times in a song or set and how we all used to “fake turn” so it didn't look like we are cheating. I like to tell them that we are going to do 9 intervals and that I'm expecting a higher average wattage after each and every interval AND an increased resistance for every new interval. I'll joke that “Yes, it sounds like the old day, but I promise if you follow along and pace properly you CAN do this set without any phantom turns.”
In order to be successful with this set it's important not to go too hard on the first 3 minute interval. I recommend a slightly below threshold effort. At the end of the first interval make sure everyone remembers their average wattage. The second interval is at a slower cadence, so more resistance is needed to “beat” the previous interval and the third interval is standing and most likely at an even slower cadence so even more resistance is needed. Moving through riding positions that require slower and slower RPM's is how we can successfully add a “turn to the right” after each interval. After the three 3 minute intervals the interval time drops to 2 minutes. Riders should be able to ride at a higher output or wattage for 2 minutes than they did for 3 minutes so the average wattage and resistance should continue to rise they work through the three riding positions and RPM ranges. The same should hold true for the 1 minute intervals as well. I recommend that riders only increase their average wattage by 1-2 watts for each interval, more than that and they are setting themselves up for failure, pun intended.
My riders love this set it teaches pacing, patience and focus as well as being a great Lactate Threshold workout.
Please leave a comment letting me know how it goes in class.
7 song harmonically mixed track, to download Right Click > Save As / Save Target As to download. Open in iTunes and then you'll see this in your Spotify Local File folder.
Recording of me teaching this 7 song set in a CardioVascularIntervals Class (CVI), CVI is a class that is taught on ANY piece of cardiovascular equipment, it is not limited to the bike. Right Click > Save As / Save Target As to download on PC or Download Linked File As on Mac. Open in iTunes and then you'll see this in your Spotify Local File folder.
A different approach with a professional researcher still produced mixed results
Let’s start with the good news. I’m sorry, I was completely pulling your leg. I really don’t have any good news. I know, that’s terrible — you can throw pencils and small farm animals at me next time you see me. I was really looking for the good news in these results and I just can’t find any. This last series of retesting the same three bikes to see if we could garner the same or similar results each time we measure the bike has led to 2 out of the 3 bikes demonstrating a “skewed distribution” of data. In other words, data that you could not and should not try to predict with because they are in a word, unreliable. That means my hope for creating a “handicap” for each bike to render them even and fair for comparisons and competitions is not possible.
Statistical measurements often use Standard Deviation to determine how much variation there is in the individual readings or occurrences of data (in our cases — the differences between the actual power and the measured power). There is something called the “Emperical Rule” (http://www.pmean.com/08/SdTooBig.html) “…it says that approximately 95% of the data lies between plus and minus two standard deviations of the mean.” This 95% rule is for data with a “normal distribution”. This is what we were hoping for when we measured the same bike several times.
Please remember, this stage of the research was RE-measuring the same bikes, not measuring the differences in power between bike computer and actual power of the power pedals. We knew all along the pure accuracy would not be there, we were simply hoping that the amount or degree to which it was “off” would be consistent.
So getting back to our “Empirical Rule”. There is a corollary to that principle, and that is “If a non-negative set of data (which we have with our power numbers study) has a standard deviation that is more than half of the mean, it is an indication that the data deviates substantially from a bell shaped curve. Almost always this is an indication of a skewed distribution.” The second column to the end (right side) indicates if the distribution of repeat, same bike readings has a skewed distribution or not.
Bike 14 tested 3 separate times, looking for consistency between tests, for reliability to set bike handicaps.
With bike #14, it is notable that Trial #2 and #3 area actually fairly close except for at the 175 Watt stage. However, when we add our first set of numbers to the analysis, all but two wattage levels are skewed. If we just consider 1 bike, we might make a case that if we were to do 5 to 10 repeat trials, we might see these better numbers continue. This was something Sarah (our statistician) suggested as a next possible phase of the research; to conduct a much higher number of trials to see if we begin to see greater consistency or normalcy to the data.
Bike 1 tested 3 separate times, looking for consistency between tests, for reliability to set bike handicaps.
Again, with bike #1 we have only 2 out of 7 different wattage stages that are not demonstrating a skewed distribution of data. At a “gut feel” level, I was hoping to see less than 5 watts difference between measurements of power when it was the same stage. I was willing to accept a difference of 10 watts since accuracy was still not the main driver here. However, again we must remember this is not the power difference, but just the repeating values on the same bike — how reliable it is for a consistent representation of power. Unfortunately, 30% of all the individual stages rendered differences greater than 10 watts and statistically 4 out of the 7 stages were considered skewed.
A Glimmer of Hope?
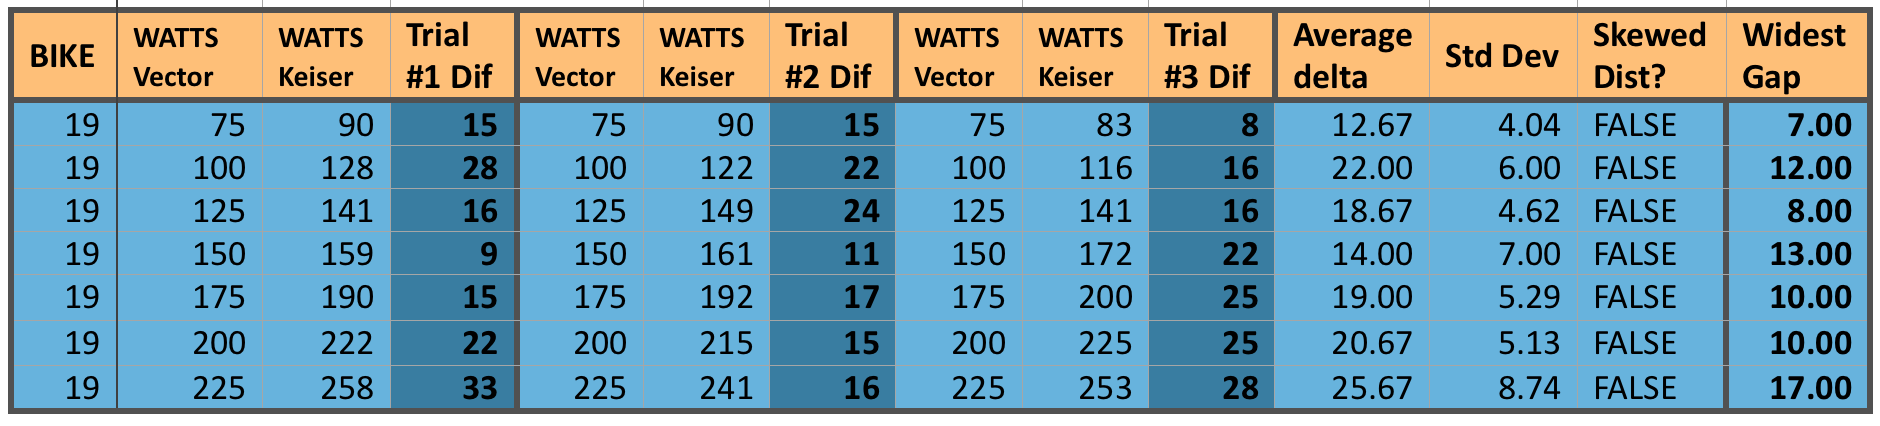
Bike 19 tested 3 separate times, looking for consistency between tests, for reliability to set bike handicaps.
Our last bike does seem to show a glimmer of hope though. While this specific bike had some of the largest differences in actual to measure power differences (in the 15 to 25 watt range), at least it showed those big swings fairly consistently. Notice how small the Standard Deviation is compared to the average delta (simply means the difference) among all three trials. This thus demonstrates a more “normal” distribution and could indeed support a type of “Power Handicap”.
So perhaps I have saved the good news for last. Maybe… just maybe, this means that some bikes would be amenable to a type of handicap while others may not. Picking up on Sarah’s suggestion, a lot more research (translate that — time spent repeating tests on the same bikes, many bikes) might lead to a set of bikes that are “good to go” with a handicap, and a set that are not. Naturally, being the proverbial curious cat, I would want to find out if there is some reason the unreliable bikes are that way. We might even be able to take those bikes through a preventive maintenance routine, recalibrate them to the furthest extent, and repeat the same retests. If we come up with a majority of the bikes being statistically solid and reliable, then we have not only created a handicap system, but we’ve validated the calibration method.
However, having spent as many hours as I have so far on this project, I’ve hung my lab coat up for now, so you won’t be blinded by science from me or a while. If I were Keiser corporation though, I believe I would have a vested interest in picking up where this research left off. I have moved this conundrum past the “blank page” and created a possible path that they could very well negotiate to a workable solution for their clients. Perhaps many clients don't care. I get that – not everyone even uses the training tools. Yet they were bold enough to lead the industry with power and have played a major role in seeing this industry change for the good. I believe Joe Public is becoming increasingly more savvy when it comes to training, and this is rapidly becoming a more educated marketplace. Especially if they consider just their own clients, such an undertaking should be received very well, supporting their image as a company that takes training seriously enough to put in the time and energy to make it right.
Making sure this process is repeatable with each bike tested is essential to our objectives.
Let’s recap what we’ve done so far in our video blog series:
1. We have introduced the whys and wherefores of this Indoor Cycling Power research project
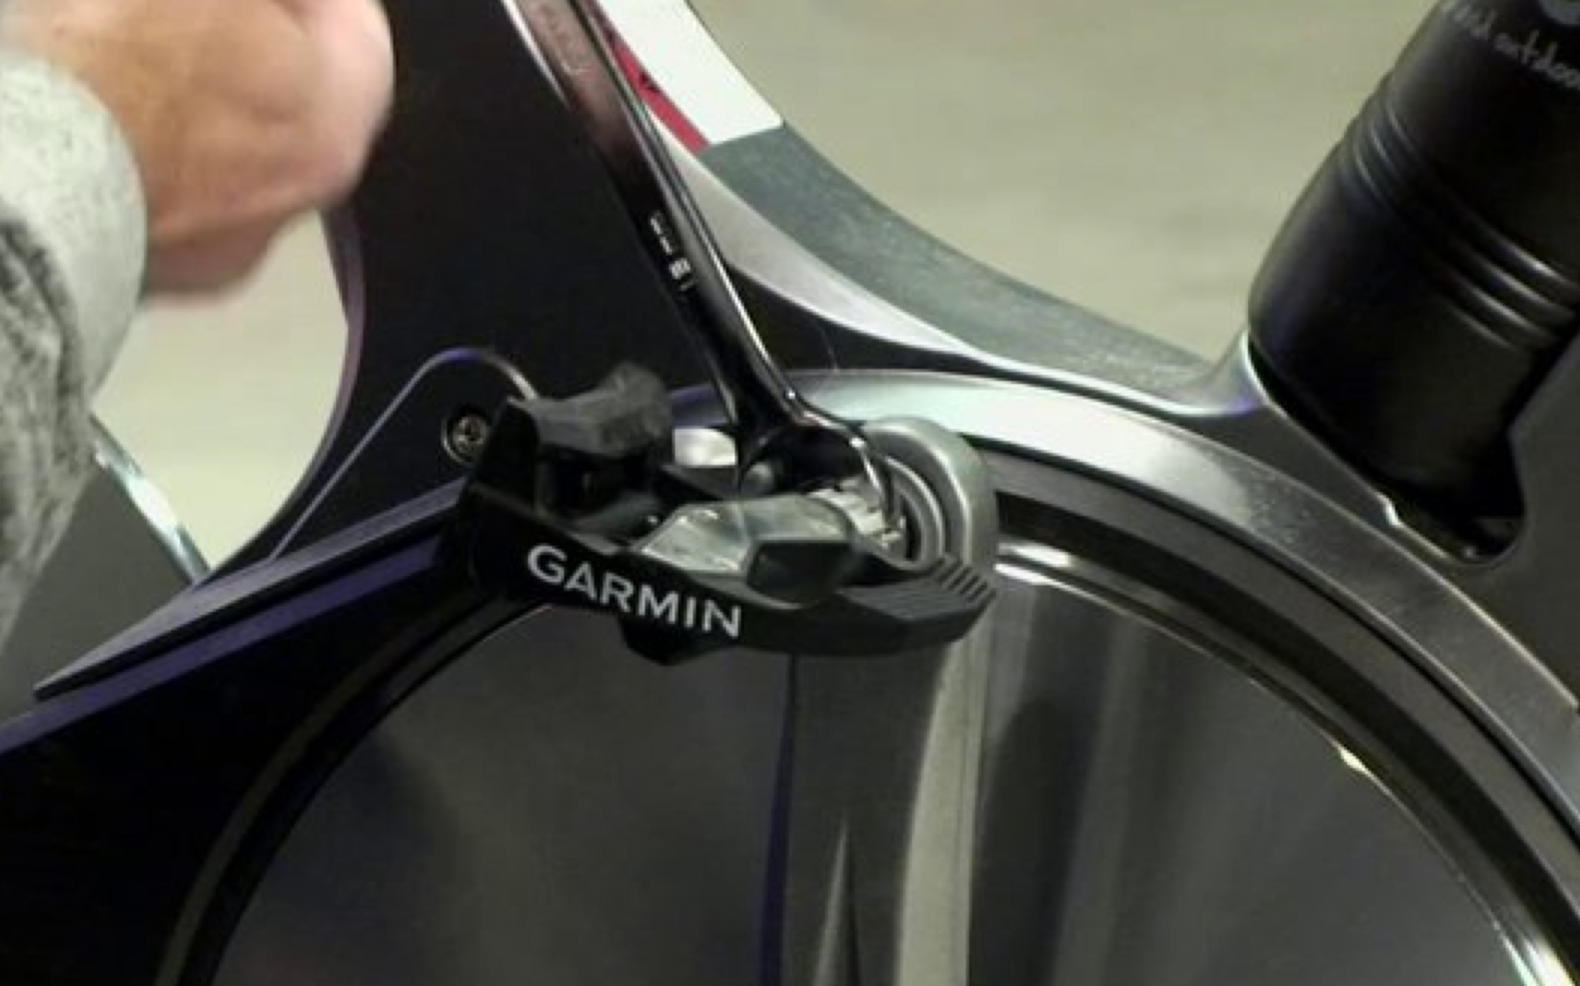
2. We’ve shown exactly how the Garmin Vector pedals get mounted to the Keiser m3 indoor cycle bike
3. We’ve demonstrated from start to finish, the precise protocol used in conducting repeatable tests on each bike
4. Last week we stepped through the process for getting the data from both the Garmin bike computer and the Keiser m3 console (manually recorded) put into the a consolidated spread sheet.
Accuracy & Reliability Are Two Different Things
This week we move into the steps required to begin validating the reliability of our equipment and/or our process. This is as crucial a consideration as the pure accuracy of the data. If we can’t confirm that our process of measuring power is consistent on any one given bike from one day to the next, how can we expect to handicap the bike for accuracy with a number or even series of numbers for different wattage levels since an unrepeatable test would mean this handicap would not be valid from one day to the next.
Consider the frustration of weighing yourself each day on a scale that can not show you 50 lbs from a 50lb weight from day to day. On some days you’ll be depressed while others you’ll be “woo hooing” all the while your weight has stayed the same. It’s an absolute critical component of our findings; to know what we are doing is repeatable and reliable. If it isn’t, we need to consider if the process is changing and causing the inconsistencies, or if the equipment is doing so. While I have tried to be more than methodical about every aspect of this process from pedal calibration to bike test execution, I will not rule out tester error or inconsistency for the moment. Let’s just first see how our numbers turn out before we decide which factor to consider (test process, or equipment variability).
Coach Gino Explains Why Validation & Reliability Are Important
The 2 video segments that make up this post are both quite short. The first one describes in detail how to unmounts the Vector Power pedals in order to use them on a second bike. It is important that we don’t just leave the pedals on and do multiple tests on the same bike. This would not tell us if that bike will be reliable one day to the next. We must first test other bikes, and then come back to bikes we’ve tested.
The second video segment is showing one complete test again (like our 2nd video), only this time on one of the bikes already tested from a previous session.
Maybe a better title for this blog would have been “The Devil’s In The Details”. Fortunately I did receive some offers from some real suckers… er… I mean some really nice riders who want to help me out as we take our walk in the enchanted forest of Muscular Endurance. But as any adventure worth taking goes, there is the planning and paperwork that must go along with it.
First there’s the inevitable “If you die it’s not my fault” waiver — every fitness facility and cycling studio has to have one, and if you do metabolic testing or mad scientist stuff like we are want to do, then you have to have a really BIG one.
Next you need some basic instructions to give to your test subjects unless you plan on supervising every minute of every trial. Don’t really have the time for that? I didn’t think so. No one does, but yet it is imperative that we keep everyone on the “same page”. What better way than to copy that page and give it to each one of them — we call that our data collection protocols (see how scientific sounding we make things). It’s really just instructions. it’s not rocket science, but it’s these little things that when missed, is like catching you napping in the poppy fields.
Data Integrity & Consistency
If we want to draw any sort of conclusions at all about our results, we need to make sure that we both execute the drill in a consistent manner, and collect or document each trial (the specific drills assigned to the study participants) accurately. Aside from being detailed in our instructions, we also should provide a spreadsheet or at least a paper form that will somewhat “force” each rider to speak the same language.
This not only helps with the consistency of reporting, but it will also make aggregating the data across each of the subjects easier to complete. I have therefore prepared a spreadsheet that has tables for recording both the Baseline (Pre-research or “before”) test and the Performance (the after-research) test. In addition, I have prepared 1 table for each of the 4 weeks in our study.
Oh My!
Finally, the “Oh My!” part of this adventure is here as I assumed that our subjects would want to print out the spreadsheet to help them record their numbers soon after their workouts since there is that risk of memory leakage (some of us more than others J ). Anyway, I looked at the “print view” and yep — that’s when I said “Oh My!” as I had to scrap 3 of the 4 tables and reformat the first one so it could be more easily printed — and then of course export them for both Mac and Windows versions. So you see, it really was a dark and scary forest with flying monkeys after all.
Any last minute volunteers are still welcome. I still don’t have 10 volunteers, but I must get started. Please comment on this post if you are going to participate, and you can find the forms and spreadsheets at this dropbox link. I have several versions of the spreadsheet so hopefully it will work for most participants: https://www.dropbox.com/sh/6bugjlb8wtew1iy/HdspfwB7D_
We start collecting data on Saturday 8/11, so please email me your waivers and any questions you might have. See you in OZ!