
by Gino | Dec 11, 2017 | Instructor Training, Master Instructor Blog, Training With Power

Coach Gino walks us through data collection
The first two video blogs showed the detailed process of performing power tests on the Keiser m3 bike with Garmin Vector power pedals mounted on them so that the power shown on the Keiser m3 can be compared to the power being measured by the Vector pedals. As you know, the m3 displays power based on a calculation or table within the computer that is a function of the magnet’s position with respect to the flywheel and the speed of your pedaling (cadence or RPM).
The standard approach considered most accurate and reliable in the industry is to measure the power where it is applied — somewhere between the feet moving those pedals, and the axel of the wheel being propelled forward by the pedaling motion. Power meters can now be found in any number of places along that continuum; from the pedals to the crank arms to the bike’s bottom bracket and the most widely used place of all – in the hub of the rear wheel. These power meters contain strain gauges that literally are sensing the torque or force being applied as you pedal.
It is these power readings that are then recorded on the Garmin 500 bike computer that I paired to the Vector power pedals to get a true reading of power being exerted during each pedal stroke. In fact, there are strain gauges in each pedal so that it also reports on the differences in power generated from each pedal; left and right. So we now can know what the real power numbers are as we work out on the Keiser m3.
This is the 3rd video in the series that shows the exact process I underwent to take the data generated (from both the Keiser bike and the Vector pedals ) during these tests and record them. The recording of data included both graphic snapshots as well as detailed numeric data from both the Garmin and the hand written readings taken during the actual test (since the Keiser offers no way to retrieve the data from their computer). These were all then copied into a single spreadsheet for comparison and analysis.
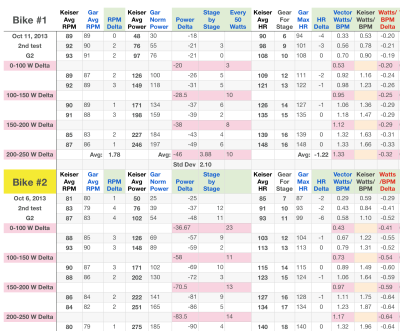
Spreadsheet shows both Keiser display and Garmin Vecor #s
I warn you, if you are not a data geek, and are not experienced in the unique joys of number crunching, this video may not be safe for you. Make sure to have soft surroundings as you watch this video. Without the proper training and experience, you may find yourself falling asleep at an alarmingly fast rate. Viewer beware! Click the link below if you dare… I mean to watch the video. ☺
Watch the 3rd video blog.
http://vimeo.com/78927160
Indoor Cycling Power Accuracy & Validation Research from Cycling Fusion on Vimeo.
Originally posted 2014-01-29 17:21:10.
by Gino | Dec 7, 2017 | Instructor Training, Master Instructor Blog, Training With Power
Data Collection for the Power Accuracy Research project
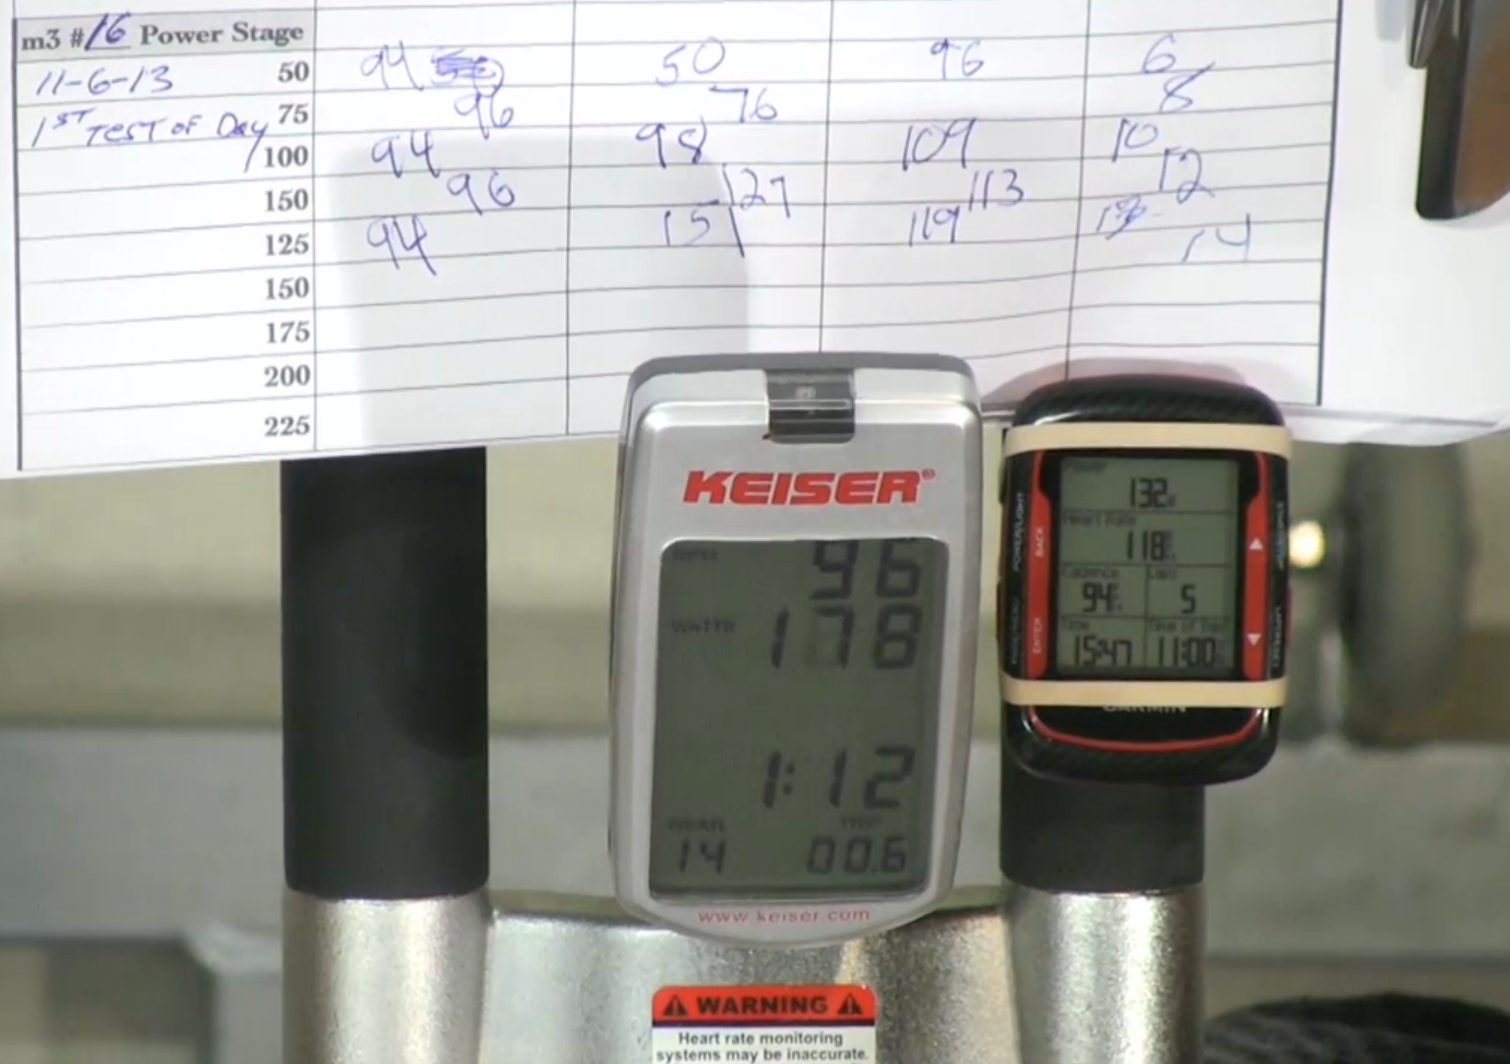
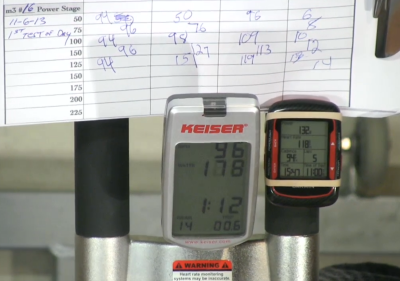
On the last blog post (8/11/17) v we spent a considerable amount of time showing how we set up the test, the equipment, calibrating the power pedals for each trial, positioning all of our data collection tools, and just preparing each test in a methodical manner. This post picks up where we left off and is the only video blog showing the entire test performed on the Keiser m3 with the Vector Power Pedals. This was done so that the reader can see the precise protocol used for all of the trials for all of the different bikes and the repeats with the same bikes.
I only recorded one full session (out of the 25 to 30 total that I performed) as a “reference” session so that the full and complete protocol can be understood and seen. You can even follow along with your own bike if you want to ride while you watch this video.
The most interesting thing to note is that you can see the power clearly as the test progresses between the Keiser and the read out on the Garmin. The variance is significant.
Watch the 2nd video blog.
http://vimeo.com/78919570
Indoor Cycling Power Accuracy Research from Cycling Fusion on Vimeo.

by Joan Kent | Dec 6, 2017 | Health and Wellness, Master Instructor Blog

By Joan Kent
One significant reason for sugar cravings is withdrawal. Withdrawal can promote cravings under various circumstances.
If someone has recently stopped drinking alcohol, cravings for sugar can be strong and frequent. This involves the brain chemicals stimulated by alcohol. The same three chemicals (dopamine, beta-endorphin, and serotonin) are also stimulated by sugar.
The similarity makes sugar a short-term substitute for alcohol when cravings occur. It also explains why people in recovery from alcohol (or drugs) may crave sugar and may eat it often or in large quantities. Or both.
The phenomenon is so common that AA meetings typically feature back-of-room treats that are laden with sugar: cookies, brownies, cakes, pastries. That approach can backfire, but we’ll get to that in a moment.
If someone is addicted to sugar, quitting sugar can lead to cravings. The effect may sometimes be similar to the symptoms of alcohol withdrawal or opiate withdrawal — and also similar to the symptoms of hypoglycemia (low blood glucose).
(As a side note, I postulated years ago that hypoglycemia — especially reactive hypoglycemia, the rapid glucose drop following sugar ingestion in susceptible people — was a specific case of sugar withdrawal. Reviewing the lists below makes it seem there’s a case to be made for that.)
Research shows that cravings are highest when withdrawal is most severe. The higher the level of intake prior to abstinence, the greater the withdrawal and subsequent craving.
Anyway, let’s look at the symptoms in the different cases.
Alcohol withdrawal symptoms include anxiety, nervousness, depression, fatigue, irritability, shakiness, mood swings, nightmares, pupil dilation, clammy skin, headaches, insomnia, nausea, vomiting, sweating, muscle tremor, confusion, rapid heart beat.
Symptoms of hypoglycemia include shakiness, nervousness, anxiety, sweating, chills, irritability, confusion, rapid heartbeat, lightheadedness, dizziness, hunger, nausea, sleepiness, blurred vision, tingling or numbness in the lips or tongue, headaches, weakness, fatigue, anger, sadness, lack of coordination, nightmares, seizures, unconsciousness, confusion, difficulty speaking, night sweats, waking up tired, irritable or confused.
Opiate withdrawal symptoms include agitation, anxiety, muscle aches, eye tearing, insomnia, runny nose, sweating, yawning, abdominal cramping, diarrhea, dilated pupils, goose bumps, nausea, vomiting, fever.
Research on lab animals that have been made addicted to sugar lists withdrawal symptoms that resemble those of opiate withdrawal.
An internet search on symptoms of sugar withdrawal offers lists that include hunger and the desire for sugary foods; headaches; low energy, fatigue; mood swings, crankiness; muscle aches and pains; nausea and other gastric upsets; chills or sweating, especially at night; runny nose; yawning; insomnia.
As you can see, there is quite a bit of overlap in these various symptom lists.
So is sugar withdrawal just like withdrawal from opiates or alcohol? Some would say yes. Some would say that’s too big a stretch. After all, the body has only so many ways of expressing itself, so a similarity in symptoms doesn’t necessarily link them.
But we do know that sugar affects, either directly or indirectly, the same brain chemicals that are affected by alcohol and opiate drugs. As mentioned above, the similarity makes sugar a short-term substitute for alcohol.
However! Eating sugar when you crave either alcohol or sugar can backfire, due to a phenomenon known as priming (i.e., a little makes us want more).
Some people insist priming doesn’t apply to food, just to alcohol or drugs. Clinical experience shows that it does apply, and that avoiding possible priming cues goes a long way toward ending cravings. My advice would be to take priming seriously if you want to end sugar cravings.
[If you have students who need help dealing with sugar cravings and sugar addiction, please let me help. My new program, Last Resort Nutrition® with Joan Kent, starts soon. I also offer individual coaching.]


