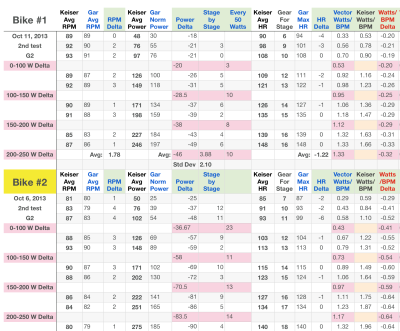
The first two video blogs showed the detailed process of performing power tests on the Keiser m3 bike with Garmin Vector power pedals mounted on them so that the power shown on the Keiser m3 can be compared to the power being measured by the Vector pedals. As you know, the m3 displays power based on a calculation or table within the computer that is a function of the magnet”™s position with respect to the flywheel and the speed of your pedaling (cadence or RPM).
The standard approach considered most accurate and reliable in the industry is to measure the power where it is applied — somewhere between the feet moving those pedals, and the axel of the wheel being propelled forward by the pedaling motion. Power meters can now be found in any number of places along that continuum; from the pedals to the crank arms to the bike”™s bottom bracket and the most widely used place of all - in the hub of the rear wheel. These power meters contain strain gauges that literally are sensing the torque or force being applied as you pedal.
It is these power readings that are then recorded on the Garmin 500 bike computer that I paired to the Vector power pedals to get a true reading of power being exerted during each pedal stroke. In fact, there are strain gauges in each pedal so that it also reports on the differences in power generated from each pedal; left and right. So we now can know what the real power numbers are as we work out on the Keiser m3.
This is the 3rd video in the series that shows the exact process I underwent to take the data generated (from both the Keiser bike and the Vector pedals ) during these tests and record them. The recording of data included both graphic snapshots as well as detailed numeric data from both the Garmin and the hand written readings taken during the actual test (since the Keiser offers no way to retrieve the data from their computer). These were all then copied into a single spreadsheet for comparison and analysis.
I warn you, if you are not a data geek, and are not experienced in the unique joys of number crunching, this video may not be safe for you. Make sure to have soft surroundings as you watch this video. Without the proper training and experience, you may find yourself falling asleep at an alarmingly fast rate. Viewer beware! Click the link below if you dare… I mean to watch the video. ☺
Watch the 3rd video blog.
Indoor Cycling Power Accuracy & Validation Research from Cycling Fusion on Vimeo.
Originally posted 2014-01-29 17:21:10.
- Me & My Big Mouth - April 18, 2024
- Indoor Cycling Power Research #7: Good News, Bad News - August 16, 2023
- Blog Post #10 Baseline& Performance Testing - June 29, 2023


I have a keiser M3 and I am frustrated in not being able to use it with my Garmin 810 or with Zwift. If I change out the pedals to the Garmin Vector will I then be able to achieve these goals? Thank you- Mike
The answer to your question is unfortunately NO. We have been working now for 6 months just to get the data out of the LATEST M3i with Bluetooth, but even then, it will only work with Keiser Buddy Pro – an iPhone app – once we see acceptance of this, we will try to port it to the android and other computer software applications like Zwift – but one step at a time – with each step costing us tons of resources.