
by Joey Stabile | Dec 12, 2017 | Best Practices, Class Work-Sets, Instructor Training, KEEPING IT FUN, Master Instructor Blog, Training With Power
Welcome to the The Weekly Ride by Cycling Fusion:
No more hunting for new music or counting out cues. Here is your ready to ride document, that can be displayed from your phone, or printed out onto cue cards. This ride is timed out, down to the second, to make your life as easy as possible!
(more…)

by Gino | Dec 11, 2017 | Instructor Training, Master Instructor Blog, Training With Power
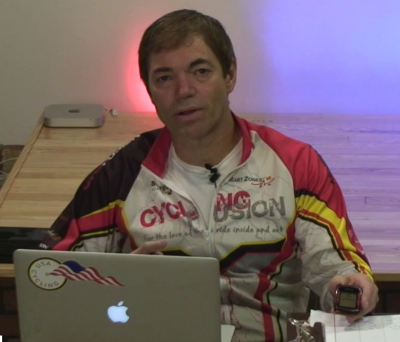
Coach Gino walks us through data collection
The first two video blogs showed the detailed process of performing power tests on the Keiser m3 bike with Garmin Vector power pedals mounted on them so that the power shown on the Keiser m3 can be compared to the power being measured by the Vector pedals. As you know, the m3 displays power based on a calculation or table within the computer that is a function of the magnet’s position with respect to the flywheel and the speed of your pedaling (cadence or RPM).
The standard approach considered most accurate and reliable in the industry is to measure the power where it is applied — somewhere between the feet moving those pedals, and the axel of the wheel being propelled forward by the pedaling motion. Power meters can now be found in any number of places along that continuum; from the pedals to the crank arms to the bike’s bottom bracket and the most widely used place of all – in the hub of the rear wheel. These power meters contain strain gauges that literally are sensing the torque or force being applied as you pedal.
It is these power readings that are then recorded on the Garmin 500 bike computer that I paired to the Vector power pedals to get a true reading of power being exerted during each pedal stroke. In fact, there are strain gauges in each pedal so that it also reports on the differences in power generated from each pedal; left and right. So we now can know what the real power numbers are as we work out on the Keiser m3.
This is the 3rd video in the series that shows the exact process I underwent to take the data generated (from both the Keiser bike and the Vector pedals ) during these tests and record them. The recording of data included both graphic snapshots as well as detailed numeric data from both the Garmin and the hand written readings taken during the actual test (since the Keiser offers no way to retrieve the data from their computer). These were all then copied into a single spreadsheet for comparison and analysis.
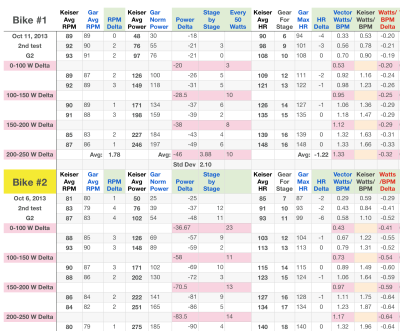
Spreadsheet shows both Keiser display and Garmin Vecor #s
I warn you, if you are not a data geek, and are not experienced in the unique joys of number crunching, this video may not be safe for you. Make sure to have soft surroundings as you watch this video. Without the proper training and experience, you may find yourself falling asleep at an alarmingly fast rate. Viewer beware! Click the link below if you dare… I mean to watch the video. ☺
Watch the 3rd video blog.
http://vimeo.com/78927160
Indoor Cycling Power Accuracy & Validation Research from Cycling Fusion on Vimeo.
Originally posted 2014-01-29 17:21:10.
by Gino | Dec 7, 2017 | Instructor Training, Master Instructor Blog, Training With Power
Data Collection for the Power Accuracy Research project
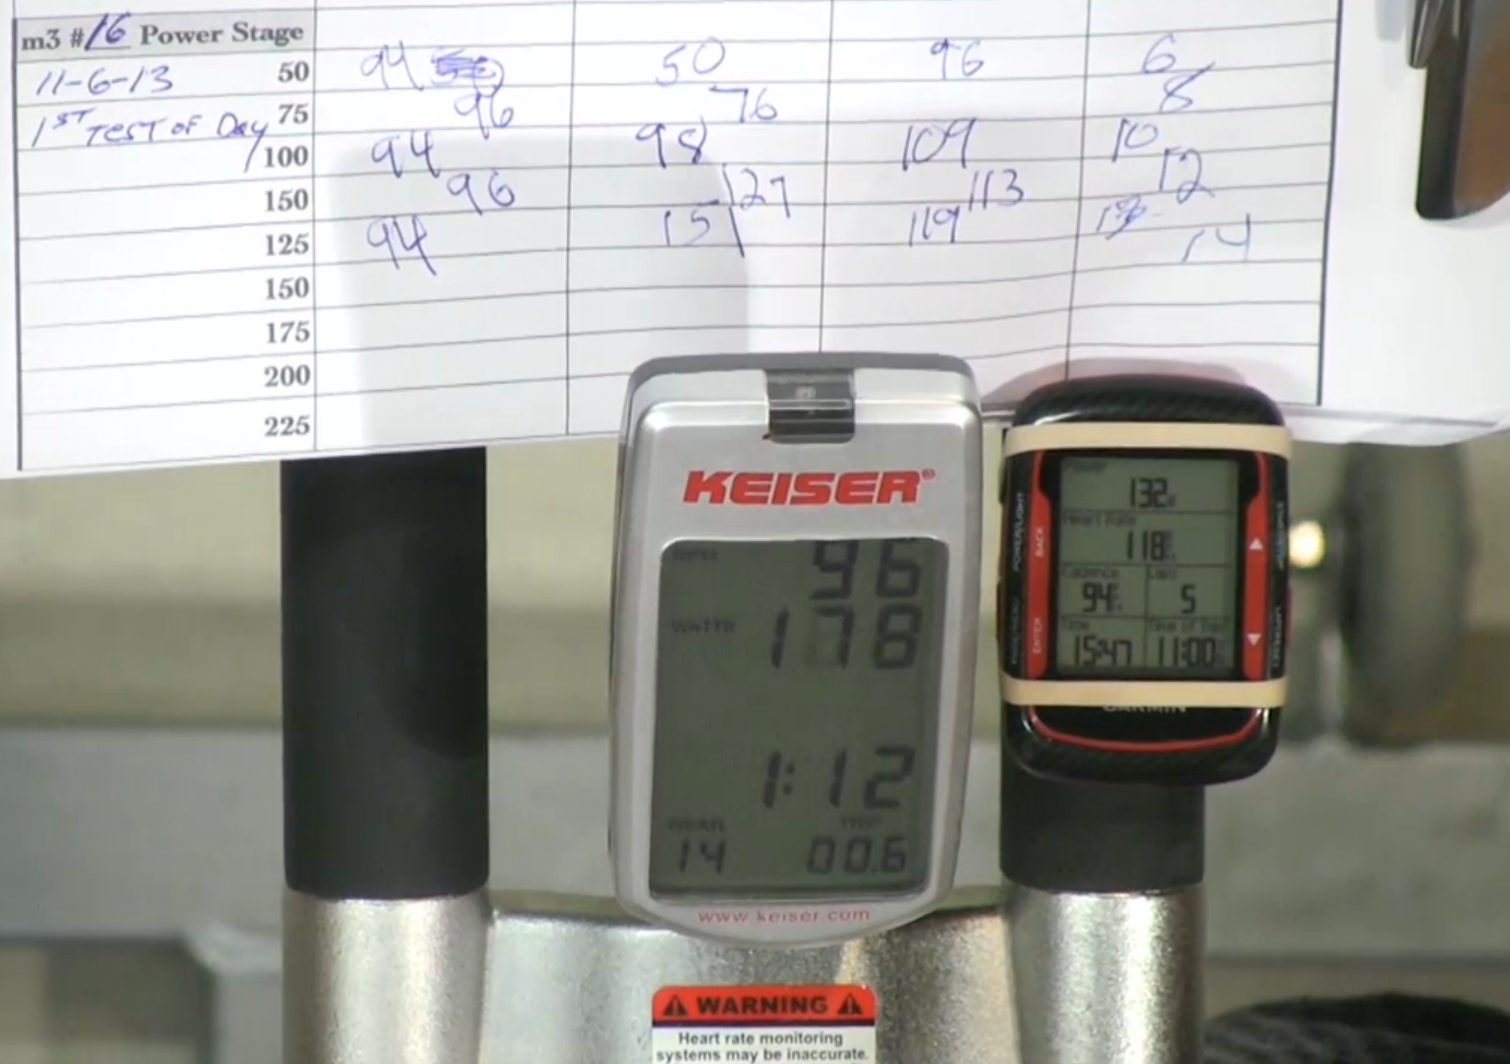
On the last blog post (8/11/17) v we spent a considerable amount of time showing how we set up the test, the equipment, calibrating the power pedals for each trial, positioning all of our data collection tools, and just preparing each test in a methodical manner. This post picks up where we left off and is the only video blog showing the entire test performed on the Keiser m3 with the Vector Power Pedals. This was done so that the reader can see the precise protocol used for all of the trials for all of the different bikes and the repeats with the same bikes.
I only recorded one full session (out of the 25 to 30 total that I performed) as a “reference” session so that the full and complete protocol can be understood and seen. You can even follow along with your own bike if you want to ride while you watch this video.
The most interesting thing to note is that you can see the power clearly as the test progresses between the Keiser and the read out on the Garmin. The variance is significant.
Watch the 2nd video blog.
http://vimeo.com/78919570
Indoor Cycling Power Accuracy Research from Cycling Fusion on Vimeo.
by Joey Stabile | Dec 5, 2017 | Best Practices, Class Work-Sets, Instructor Training, KEEPING IT FUN, Master Instructor Blog, Training With Power
Welcome to the The Weekly Ride by Cycling Fusion:
No more hunting for new music or counting out cues. Here is your ready to ride document, that can be displayed from your phone, or printed out onto cue cards. This ride is timed out, down to the second, to make your life as easy as possible!
(more…)
by Gino | Nov 30, 2017 | Training With Power
 No, MSP doesn’t stand for “My Secret Pal”, nor does it stand for “Mom’s Special Potion”, and I’ll stop right there before this gets really silly. MSP stands for Maximum Sustainable Power. It is the level of power once can sustain for a specific time interval. When you are referencing an hour interval (measured and estimated with 20 minute tests), most elite cyclists who train with power refer to this as FTP or Functional Threshold Power.
I prefer to reserve the term “Threshold” for that unique metabolic event that takes place with respect to the production of energy; the “cross-over” process between the aerobic and non-aerobic energy production systems. In my opinion, this term should be reserved for cardiovascular training (it has been used and researched with this term as the agreed upon nomenclature for years before power meters even existed). Therefore, to avoid confusing heart rate and power training terms, I do not refer to threshold with respect to power, but instead reserve its use solely to reference ones heart rate when this metabolic event occurs.
(more…)
by Joey Stabile | Nov 28, 2017 | Best Practices, Class Work-Sets, Instructor Training, KEEPING IT FUN, Master Instructor Blog, Training With Power
Welcome to the The Weekly Ride by Cycling Fusion:
No more hunting for new music or counting out cues. Here is your ready to ride document, that can be displayed from your phone, or printed out onto cue cards. This ride is timed out, down to the second, to make your life as easy as possible!
(more…)


