by Gino | Feb 25, 2014 | Instructor Training, Master Instructor Blog, Training With Power
Different Methods Same Skewed Results

A different approach with a professional researcher still produced mixed results
Let’s start with the good news. I’m sorry, I was completely pulling your leg. I really don’t have any good news. I know, that’s terrible — you can throw pencils and small farm animals at me next time you see me. I was really looking for the good news in these results and I just can’t find any. This last series of retesting the same three bikes to see if we could garner the same or similar results each time we measure the bike has led to 2 out of the 3 bikes demonstrating a “skewed distribution” of data. In other words, data that you could not and should not try to predict with because they are in a word, unreliable. That means my hope for creating a “handicap” for each bike to render them even and fair for comparisons and competitions is not possible.
Statistical measurements often use Standard Deviation to determine how much variation there is in the individual readings or occurrences of data (in our cases — the differences between the actual power and the measured power). There is something called the “Emperical Rule” (http://www.pmean.com/08/SdTooBig.html) “…it says that approximately 95% of the data lies between plus and minus two standard deviations of the mean.” This 95% rule is for data with a “normal distribution”. This is what we were hoping for when we measured the same bike several times.
Please remember, this stage of the research was RE-measuring the same bikes, not measuring the differences in power between bike computer and actual power of the power pedals. We knew all along the pure accuracy would not be there, we were simply hoping that the amount or degree to which it was “off” would be consistent.
So getting back to our “Empirical Rule”. There is a corollary to that principle, and that is “If a non-negative set of data (which we have with our power numbers study) has a standard deviation that is more than half of the mean, it is an indication that the data deviates substantially from a bell shaped curve. Almost always this is an indication of a skewed distribution.” The second column to the end (right side) indicates if the distribution of repeat, same bike readings has a skewed distribution or not.

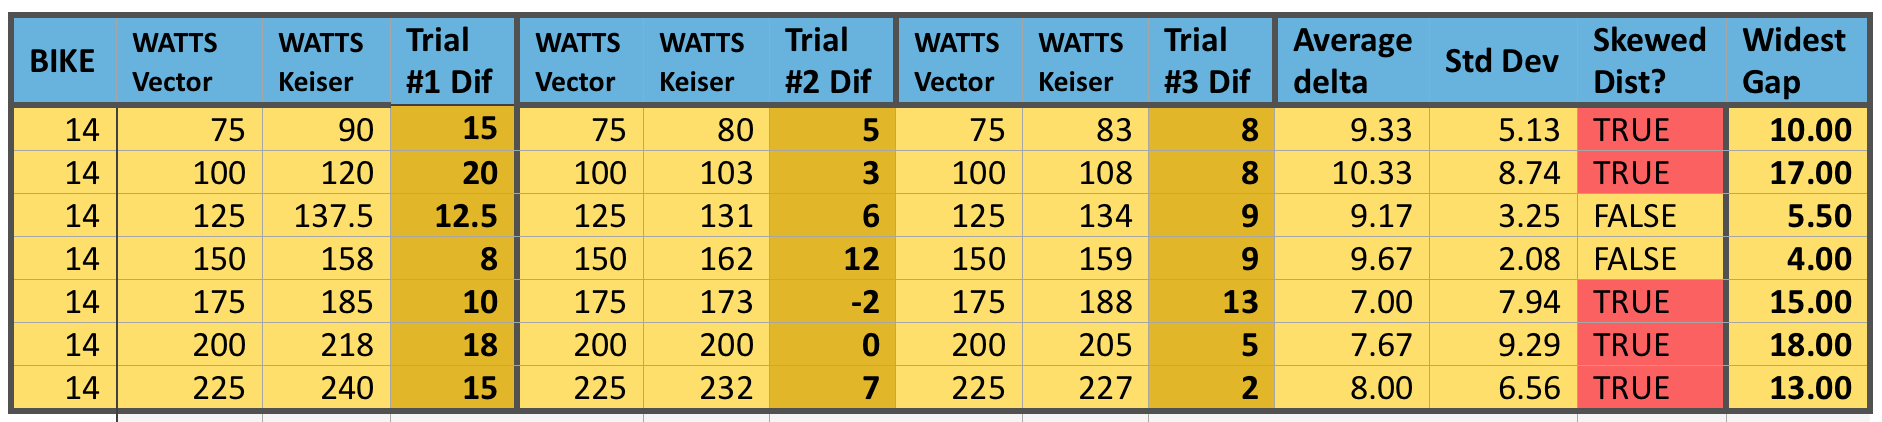
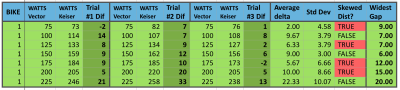
Bike 14 tested 3 separate times, looking for consistency between tests, for reliability to set bike handicaps.
With bike #14, it is notable that Trial #2 and #3 area actually fairly close except for at the 175 Watt stage. However, when we add our first set of numbers to the analysis, all but two wattage levels are skewed. If we just consider 1 bike, we might make a case that if we were to do 5 to 10 repeat trials, we might see these better numbers continue. This was something Sarah (our statistician) suggested as a next possible phase of the research; to conduct a much higher number of trials to see if we begin to see greater consistency or normalcy to the data.
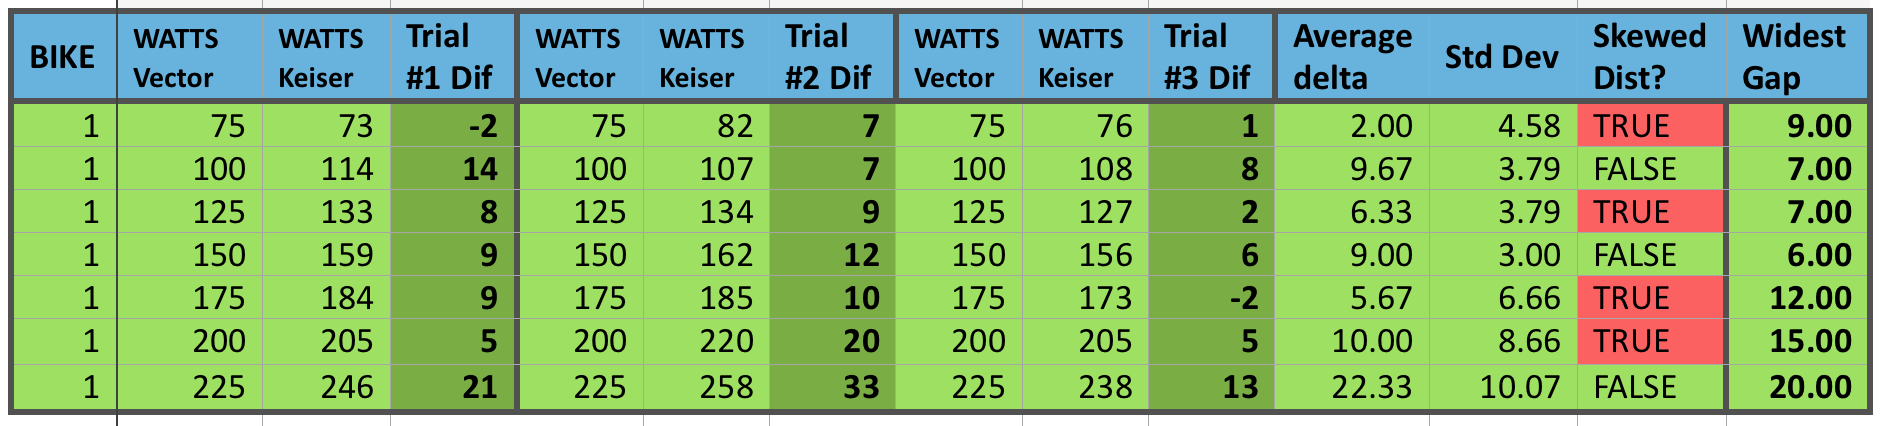
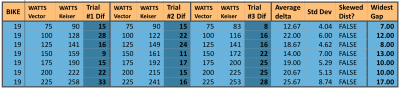
Bike 1 tested 3 separate times, looking for consistency between tests, for reliability to set bike handicaps.
Again, with bike #1 we have only 2 out of 7 different wattage stages that are not demonstrating a skewed distribution of data. At a “gut feel” level, I was hoping to see less than 5 watts difference between measurements of power when it was the same stage. I was willing to accept a difference of 10 watts since accuracy was still not the main driver here. However, again we must remember this is not the power difference, but just the repeating values on the same bike — how reliable it is for a consistent representation of power. Unfortunately, 30% of all the individual stages rendered differences greater than 10 watts and statistically 4 out of the 7 stages were considered skewed.
A Glimmer of Hope?
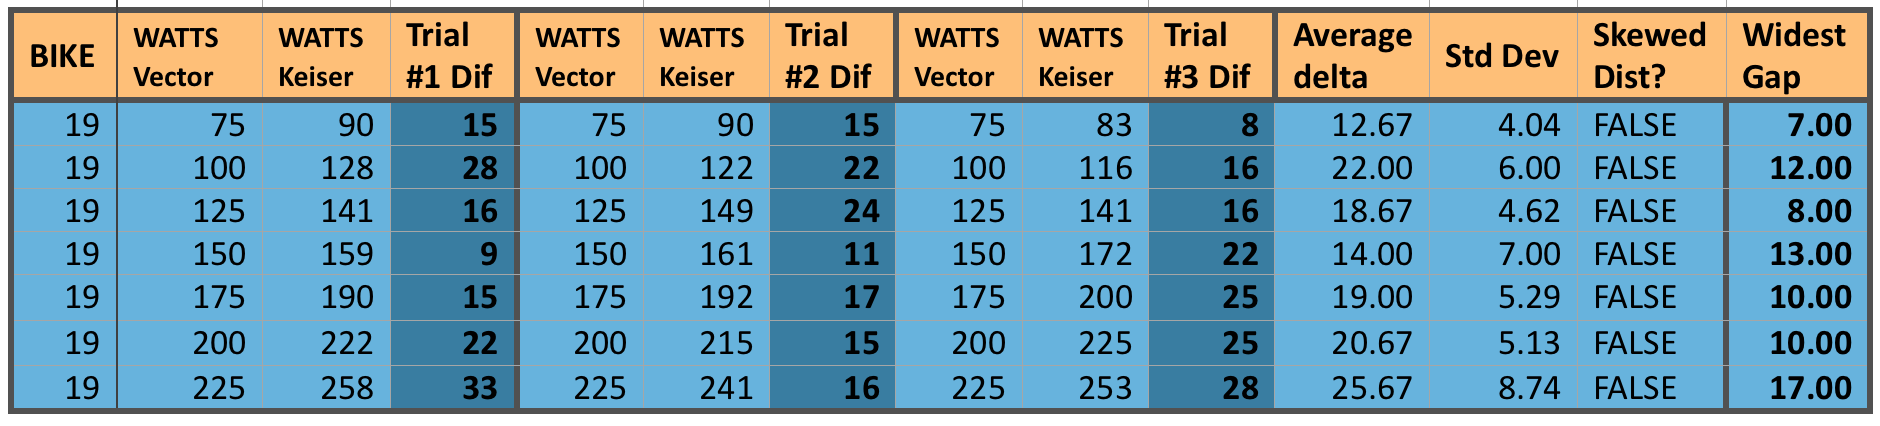
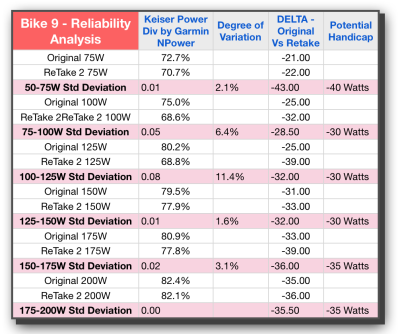
Bike 19 tested 3 separate times, looking for consistency between tests, for reliability to set bike handicaps.
Our last bike does seem to show a glimmer of hope though. While this specific bike had some of the largest differences in actual to measure power differences (in the 15 to 25 watt range), at least it showed those big swings fairly consistently. Notice how small the Standard Deviation is compared to the average delta (simply means the difference) among all three trials. This thus demonstrates a more “normal” distribution and could indeed support a type of “Power Handicap”.
So perhaps I have saved the good news for last. Maybe… just maybe, this means that some bikes would be amenable to a type of handicap while others may not. Picking up on Sarah’s suggestion, a lot more research (translate that — time spent repeating tests on the same bikes, many bikes) might lead to a set of bikes that are “good to go” with a handicap, and a set that are not. Naturally, being the proverbial curious cat, I would want to find out if there is some reason the unreliable bikes are that way. We might even be able to take those bikes through a preventive maintenance routine, recalibrate them to the furthest extent, and repeat the same retests. If we come up with a majority of the bikes being statistically solid and reliable, then we have not only created a handicap system, but we’ve validated the calibration method.
However, having spent as many hours as I have so far on this project, I’ve hung my lab coat up for now, so you won’t be blinded by science from me or a while. If I were Keiser corporation though, I believe I would have a vested interest in picking up where this research left off. I have moved this conundrum past the “blank page” and created a possible path that they could very well negotiate to a workable solution for their clients. Perhaps many clients don't care. I get that – not everyone even uses the training tools. Yet they were bold enough to lead the industry with power and have played a major role in seeing this industry change for the good. I believe Joe Public is becoming increasingly more savvy when it comes to training, and this is rapidly becoming a more educated marketplace. Especially if they consider just their own clients, such an undertaking should be received very well, supporting their image as a company that takes training seriously enough to put in the time and energy to make it right.

by Gino | Feb 11, 2014 | Instructor Training, Master Instructor Blog, Training With Power

It's time to look at the data gathered so far.
Time To Dig In
So we’ve painstakingly done everything possible to setup and prepare our methods for a solid research project — at least as solid as any “non-university” research setting can hope for. We’ve not only established a consistent protocol for conducting the tests, but we’ve also made sure to not do too many in any one day, nor to use different testers to eliminate potential influences to our results.
Once we executed these tests on about a dozen bikes, I wanted to start to analyze the data, and that’s when it occurred to me that we needed to make sure that the numbers I was about to analyze were reliable and repeatable from bike to bike. My last post demonstrated the process of re-testing to insure that very thing. After doing retests on about 6 of the 12 bikes, it is now finally time to review the data and see just what is what.
Let’s Start With The First 2 Bikes
Each day I tested only 2 bikes — to make sure I was fresh each time. So naturally, my first peak at the numbers (and I try not to look at them until I am well into the research so that initial impressions do not subconsciously alter my performance as more tests are conducted) came after these first 2 retests. Remember, I’m into the research project a couple of months now without letting myself “have a taste” — that’s pretty tough for a data-geek like me ☺. So below you will see the first two bikes retested. Let’s go over the columns so we can understand what we are looking at.

1st Keiser m3 Indoor Cycling bike with power to be tested & retested.
2nd Keiser m3 Indoor Cycling Power bike tested with the Garmin Vector Pedals
The first column represents the 25 Watt stages that were used to get the average power numbers from. These were “settled into” for 2 to 3 minutes at each of these stages. More specifically I used the Keiser console to establish a steady wattage level during each stage, and then once the 2.5 minutes were up, I stopped the keiser to get the true average (which typically was within 5 watts of the target) and we also lapped the Garmin so it would later give us the average or “Normalized Power” (NPower is how I have referred to it on the table) from the Garmin Vector Power Pedals.
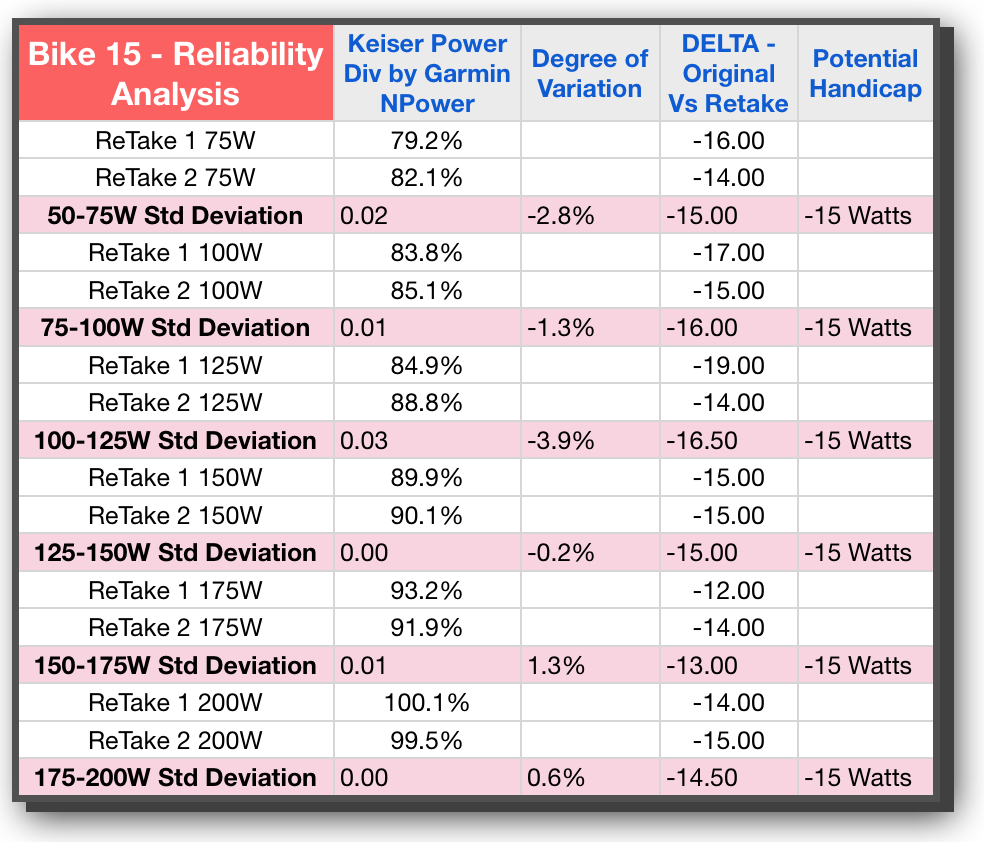
Column: Keiser Power Div by Garmin NPower
By dividing the calculated power of the bike by the measured power from the Vector power pedals, we will see by percentage just how close they are to each other. Remember, we are not concerned about pure accuracy per se — we know the calculated power is going to be inaccurate by its nature — we simply want to know how much it is off, and if that amount is reliable every time re ride that bike. Each percentage is a reflection of both bikes at a specific wattage on one test.
Column: Degree of Variation
If we now take the difference between the first test and the next, we can get at how reliable the bike is between test sessions. This is the KEY metric for our purposes during this phase of the study; validating that each bike within itself is reliable. From a practical standpoint, we need the difference between tests to be low if our handicaps are going to be valid and useful from one class to the next. In looking at both Bike 15 and Bike 9 we see that these are indeed fairly low — an initial good sign — and there is only one instance where the difference is over 10%. That’s actually a lot less than I expected.
Column: DELTA Original vs Retake
This is a “pre-handicap” column — showing the exact wattage differences at each stage of power averages. While this will produce precise numbers with decimals, we know that a practical application of handicaps would likely need to be in increments of 5 so that the math is easier when performing that handicapping in ones head. We could also use this to send to an automated system if one was ever created that could account for bike variations in the software (an insightful feature I would create if I were the purveyor of such software).
we use this column to evaluate the exact differences and averages before we designate a specific handicap number.
This column is the one that also really shows the amount of variation from one bike to the next. On Bike 15 we are averaging in the teens with wattage differences, whereas Bike 9 is averaging in the 20s and 30s. That’s quite a spread.
Column: Potential Handicap
This column would represent the entire motivation and impetus for all of the time and energy being spent on this research. We want to handicap the bikes! If you’ve read my eBook on Power (if not, no worries an updated iBook is due out soon — shameless plug apologies ☺ ), you will know that Power is not linear in its progression. As such we can not just use one number as the handicap and apply that to all wattage levels. If you look at all 4 bikes, you will see, with the exception of Bike 15, the differences get bigger and bigger as the wattage level increases. This is the exponential nature of power and the reason why I propose a handicap value for every 25 or 50 watts.
How About Some Analysis
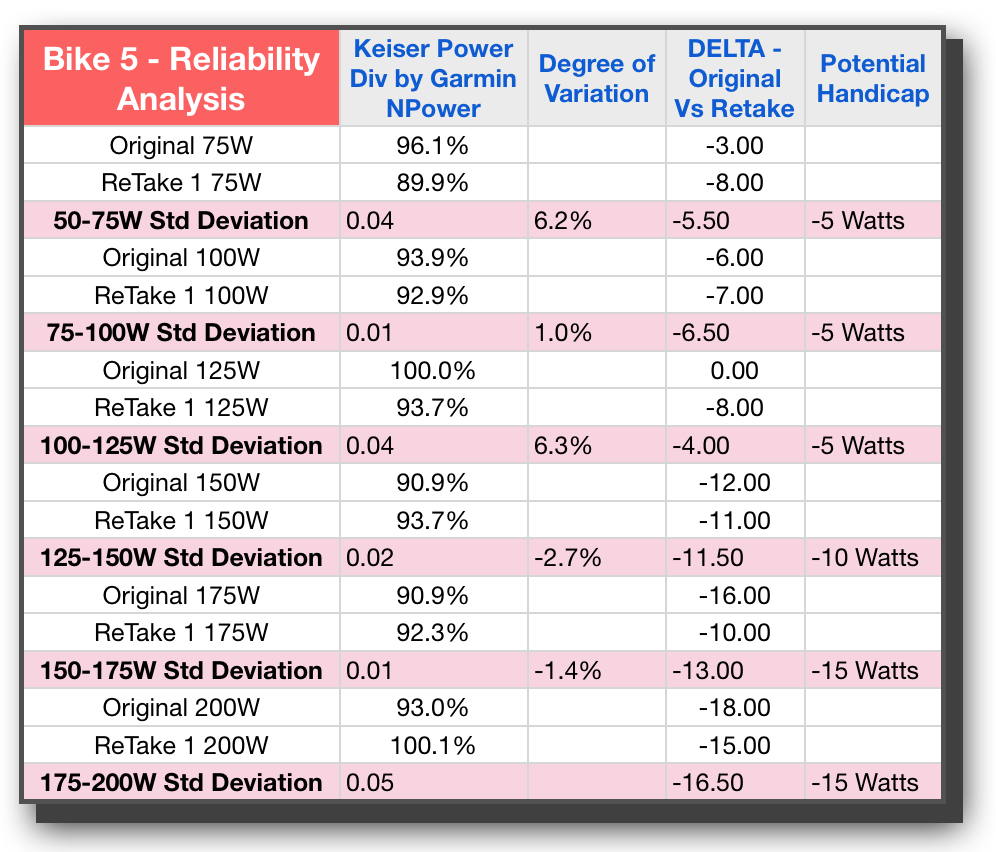
Up to now, we’ve only sprinkled the analysis or possible conclusions as I’ve described each column. However, in order to even think about drawing conclusions, we will need more data points than just 2. Lets’ show four more bikes so we can see if there are some patterns emerging when we have 6 total bikes and their retests — giving us a total of 12 tests or sets of data points to consider.

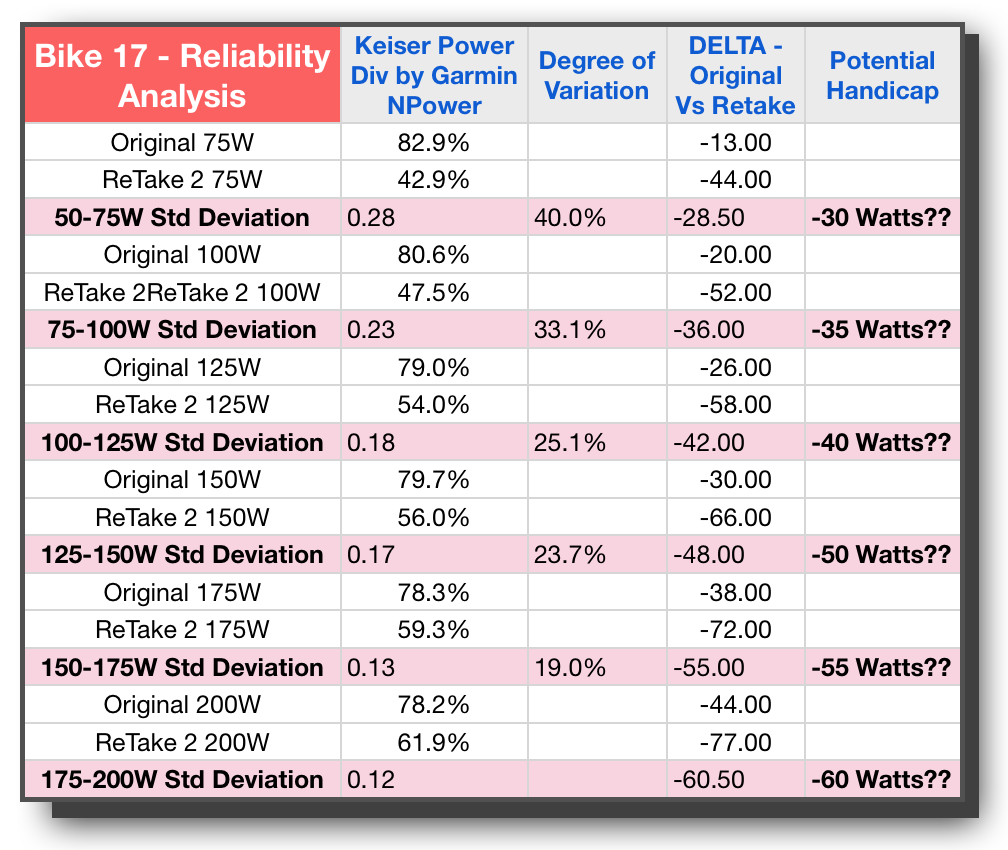
Looking at Bike 5 I’m feeling pretty good that it’s similar to #9, this time with all variation under 10% and the good power-like escalation of Potential Handicap wattage going up as a power curve would reflect. Taking a look at Bike #17 though, and I had to do a double take — WHAT?? or should I say “WAATTT!” The degree of variation is crazy. Not only that, even looking at it from a practical perspective, the Potential Handicap, aside from being huge in the 30 to 60 watt range, is simply not close to either of the trials in this study. While 30 Watts may indeed be the average between the two tests, with one being 13 and the other being 44, who knows if 30 will be too much or too little. In fact all of the stages are reflected as pretty wild for Bike 17.


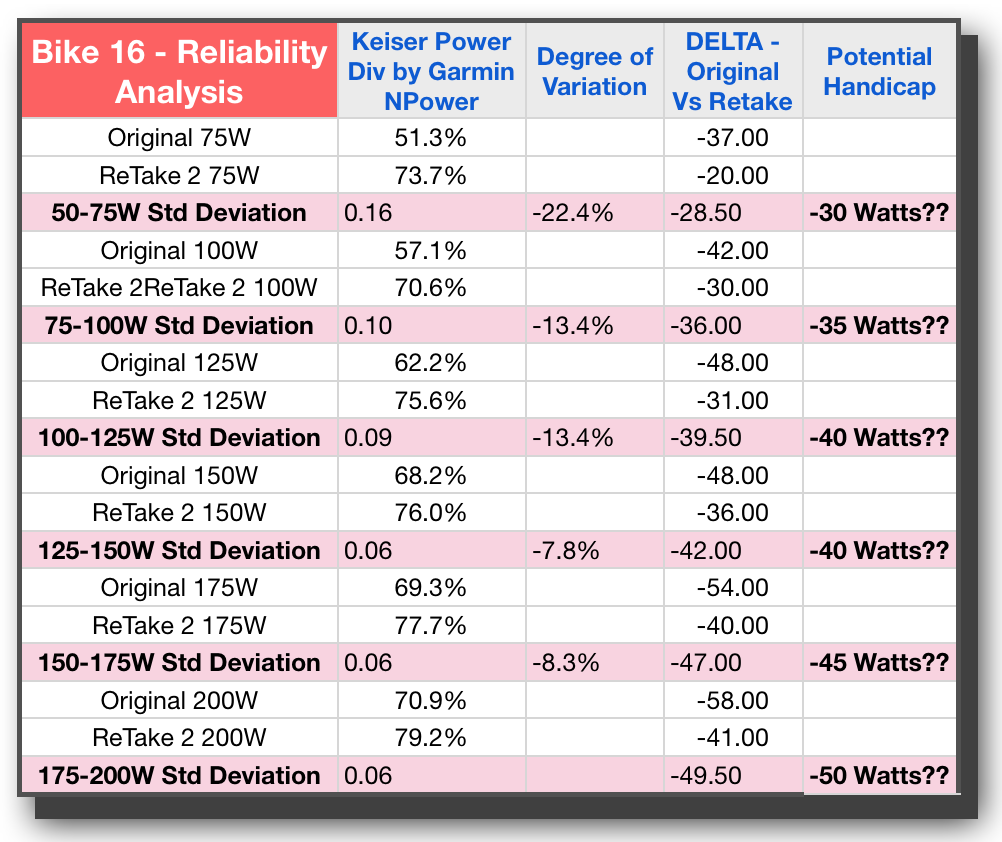
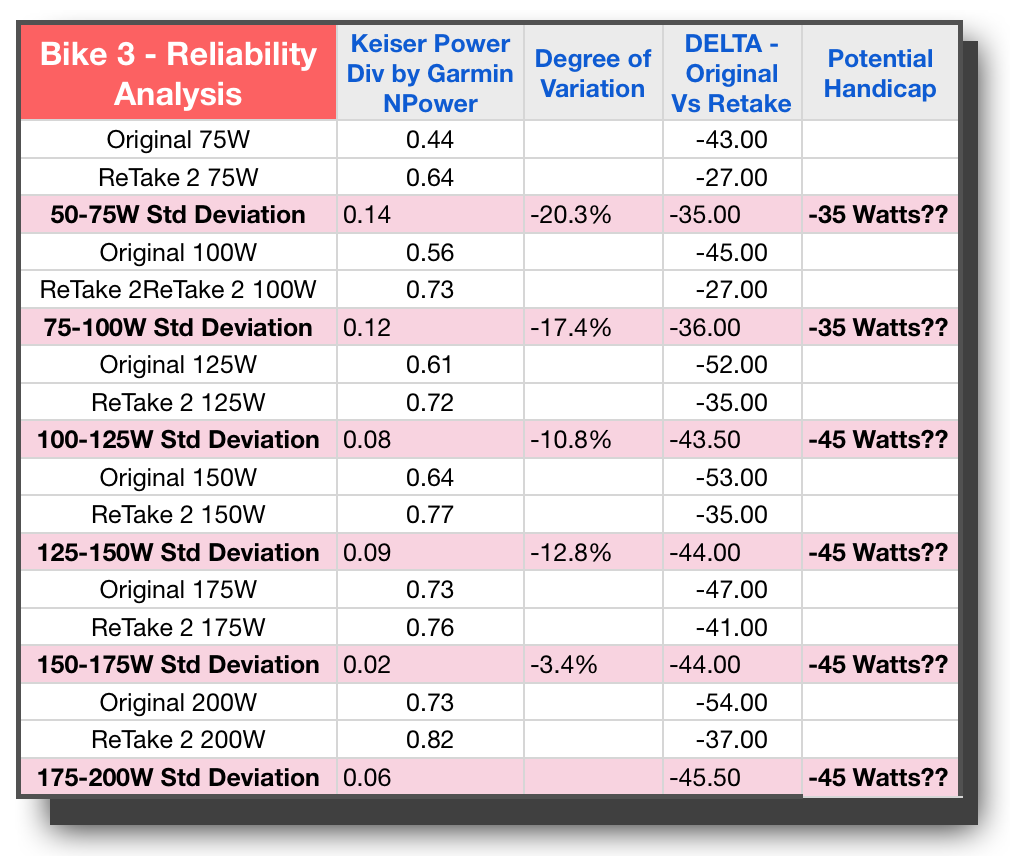
Unfortunately the bad news continues with Bike 16 and Bike 3. Both of these bikes have variations well above 10% and similar wide swings in Watts for the original delta between tests. In addition, we have bike #3 not demonstrating the proper power curve through the last 4 stages, but instead settling into one consistent difference in wattage.
Looking again specifically at these last 3 bikes, and there is no way I would be comfortable handicapping these bikes and expect it to be consistent. So all in all, we have 3 bikes that look like they would lend themselves to reliable handicaps, and three that do not. With a split decision like that, we are all but a hung jury here.
Since I recognized that I might be the problem — I am the only one conducting the tests – and while it stands to reason I would get better and more consistent over time not less, I did not want to rule that out. This data left me scratching my head more than anything else — more questions that need to be anwered. It was time to bring in bigger guns than I have.
The next blog will have another video where we brought in a professional statistician to help us get to the bottom of this.

by Gino | Feb 5, 2014 | Instructor Training, Master Instructor Blog, Training With Power
Making sure this process is repeatable with each bike tested is essential to our objectives.
Let’s recap what we’ve done so far in our video blog series:
1. We have introduced the whys and wherefores of this Indoor Cycling Power research project
2. We’ve shown exactly how the Garmin Vector pedals get mounted to the Keiser m3 indoor cycle bike
3. We’ve demonstrated from start to finish, the precise protocol used in conducting repeatable tests on each bike
4. Last week we stepped through the process for getting the data from both the Garmin bike computer and the Keiser m3 console (manually recorded) put into the a consolidated spread sheet.
Accuracy & Reliability Are Two Different Things
This week we move into the steps required to begin validating the reliability of our equipment and/or our process. This is as crucial a consideration as the pure accuracy of the data. If we can’t confirm that our process of measuring power is consistent on any one given bike from one day to the next, how can we expect to handicap the bike for accuracy with a number or even series of numbers for different wattage levels since an unrepeatable test would mean this handicap would not be valid from one day to the next.
http://vimeo.com/79224390
Indoor Cycling Power Accuracy & Validation Research from Cycling Fusion on Vimeo.
Consider the frustration of weighing yourself each day on a scale that can not show you 50 lbs from a 50lb weight from day to day. On some days you’ll be depressed while others you’ll be “woo hooing” all the while your weight has stayed the same. It’s an absolute critical component of our findings; to know what we are doing is repeatable and reliable. If it isn’t, we need to consider if the process is changing and causing the inconsistencies, or if the equipment is doing so. While I have tried to be more than methodical about every aspect of this process from pedal calibration to bike test execution, I will not rule out tester error or inconsistency for the moment. Let’s just first see how our numbers turn out before we decide which factor to consider (test process, or equipment variability).

Coach Gino Explains Why Validation & Reliability Are Important
The 2 video segments that make up this post are both quite short. The first one describes in detail how to unmounts the Vector Power pedals in order to use them on a second bike. It is important that we don’t just leave the pedals on and do multiple tests on the same bike. This would not tell us if that bike will be reliable one day to the next. We must first test other bikes, and then come back to bikes we’ve tested.
The second video segment is showing one complete test again (like our 2nd video), only this time on one of the bikes already tested from a previous session.
http://vimeo.com/79824570
Indoor Cycling Power Accuracy & Validation Research from Cycling Fusion on Vimeo.

by Bill Pryor | Mar 1, 2011 | Engage Your Students, Instructor Training, Latest News
 After more than 6 years operating a 46-bike cycling studio in the suburbs of Boston, I have seen a ton of instructors come and go. We’re not a big health club, we are a dedicated indoor cycling studio, so the survival of our business depends on our instructors abilities to fill up classes. Because we have no other source of income for the studio, our definition of a “good” instructor has to be quite pragmatic: If you fill up classes (and don’t do anything unsafe or stupid), you are by definition “good”.
This may sound mercenary, but in fact the instructors that are able to fill classes are the ones who are adept at a) engaging their students and b) providing expert guidance towards a fitness objective. They use a wide range of tools including music, imagery, language and cuing and
all the best ones have a natural ability to vary their workouts. Variety is indeed the spice of life (and of indoor cycling classes)
At our studio, the great instructors are not all alike. In fact many have vastly different styles, and while there is no sure formula for creating an experience that keeps indoor cyclists returning, I have noticed one thing all our best instructors do intuitively: they believe in variety: Variety within a class and variety from class to class.
Everyone knows the benefits of exercise, so what is the one reason we hear again and again why people won’t commit to regular workouts? “It’s boring”. What is the single biggest complaint we here about an instructor that is not drawing in our studio? “They’re boring”. A great instructor’s class is not boring, and one of the primary reasons is because they know intuitively to commit to variety.
Easier said than done of course, but here are some examples of variety from the top-drawing instructors at our studio:
- Vary playlists. Never, ever, use the same playlist twice in the same month. Not only because your regulars will notice, but also because your own energy is not as sharp. If you want to use the profile again, find substitute songs.
- Vary counting and intervals. If you are doing intervals, vary the length or at the least vary the way in which you count them up or down. (i.e. instead of counting down from 20 every time, try counting “one, two, one, three, one, four, etc. etc.” It’s a small thing but it keeps students mentally engaged.
- Vary genres of music. You may love techno or classic rock or pop….but I guarantee someone in your class does NOT. If you play only one genre, you are likely to annoy someone totally. Mixing genres is a great way to assure you find something powerful for virtually everyone and they will tolerate the stuff they’re not crazy about.
- Vary positions: most drills can be done, and most heart rates can be achieved…in or out of the saddle. Technically there is really no reason to ever come out of the saddle — other than the fact that the variety of moving in and out is appealing in an indoor cycling class. Students love it…..but they will get bored with too much work, in our out of the saddle.
Variety is simply more interesting, and more fun. It is an antidote to the worst enemies of working out: drudgery and boredom. What are some other examples of variety you use? I’m hungry for ideas!
by John | Jul 16, 2010 | Video PROfiles
 I know, it's about time we had a “Video PROfile” so here it is. While I was at Breathe Denver for the Stage 5 Cycling certification training with Tom Scotto, I shot some footage of Tom's presentation (with his permission) on teaching Strength Intervals. Here is that Video PROfile and ICI/PRO members can look forward to 4 more of these over the next month.
If you like what you see here, Tom will be training us at the ICI/PRO conference this October. There's still room in many of the sessions so if you are on the fence you may want to go ahead and register today.