by John | Feb 7, 2020 | Indoor Cycling Bikes, Instructor Training, Product Reviews, Training With Power
Spinning joins the Training With Power Wars
Star Trac had the new Spinner® Blade Ion on display at IHRSA. I rode one during Josh Taylor's 6:30 am demonstration ride this past Thursday. After the class I discussed the Ion's new features with Josh. I then got an overview of Spinning's new Spinpower™ education from Program Director Angie Sturtevant, which I'll share as a separate article.
Basics
The “Ion” differentiates this bike with Power from the conventional Spinner Blade. It uses the same chain drive and friction resistance system, found on all Spinner® Indoor Cycles.
Console / Monitor
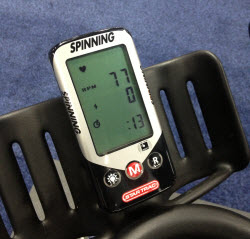
Very simple… and I'm a huge fan of simple, so right away I appreciated how easy it was to use the Ion's console. I was told they are making a few minor changes so the final version may look different. Working down from the top, the display shows:
- Heart Rate
- Cadence
- Power
- Elapsed Time
Just three buttons
- Left button turns the back-light on/off. It doesn't time out because it doesn't need to preserve battery life. It will stay on until you want it dark or you stop pedaling. I might not have this completely right – but you get the point – the light will shine all class 🙂
- Center button scrolls through screens displaying; real time and averages + calories
- Hold down the Right button for 2 seconds resets the Elapsed Time – Josh explained that this button will also add a “digital marker” to any Ant+ enabled devise, identifying the beginning or end of an interval, similar to the “Stage” button found on other consoles.
Josh made the point during his demo ride that their console will show ZERO watts when there's no resistance, regardless of the cadence = this will show all of our “spinners” that they aren't doing any real work until they've added some load.
Free Registration Required to read the rest — Click Here. Opens in a new tab.
[wlm_ismember]
Measured Power

Strain gauge measures the amount of pull on the brake pad.
The Blade Ion measures power with a strain gauge connected to the brake pad – again more simplicity. This technique is actually over 100 years old and how the horsepower of early engines was measured; by measuring the force acting on the brake, as the flywheel tries to drag the brake around it's circumference.
If you have an NXT available you can see exactly what they are doing. Remove any resistance and start the pedals turning slowly. Now carefully touch the slowly turning flywheel with one finger. Feel how it wants to drag your finger along? Can you see how the harder you press against the flywheel, the more effort it takes to hold your finger in place? By measuring that force, the speed of the rotating flywheel and then doing a bit of math, we could calculate Power.
That Black Box contains the strain gauge and replaces the normal brake pad holder on the standard Blade or NXT – which begs the question; will they ever offer a retrofit power meter for older NXT's?
What about Calibration?
I was told that the Ion will be factory calibrated and that no other calibration will be necessary – which I find very hard to believe.
This isn't the right time to get into a lengthy discussion over what I see as fundamental differences between; how the Ion measures the amount of Power coming out vs. how FreeMotion (and also any bicycle crank arm/spider or pedal based power meter) is measuring the amount of Power the rider is putting into the cycle. Or if it's really of any value…
So I don't leave you hanging here, the factory calibration may indeed accurately display the amount of coming out of the Ion forever… but does that precisely reflect the amount of power the rider is putting into the cycle?
What I'm questioning is there's a lot of drive train (multiple bearings and the chain) between the pedals (work in) and the brake mechanism (work out). This engineering article describes the efficiency of bicycle chain drive system and how losses can vary between 2% and 20%. I'm sure Star Trac's engineers have a very sophisticated algorithm to work all this out on a new Ion – but what happens over time? Worn chains and bearings, sprocket alignment and chain tension will all have an effect. Potentially some of the Ion's in your studio could become favorites because they display a higher wattage, relativity to the amount of work introduced by the rider, simply because its chain is in better alignment. Does that make sense?
No Batteries Required

Angie said she likes this because it's “green” (no batteries to throw out) – this blue light is a very cool touch.
Hands down my favorite feature of the Ion is how it charges itself. Josh told me that it incorporates a smart charging system that will allow the batteries to discharge before recharging. That wire runs from the hub charging unit & cadence counter up to the handle bars.

Phone cord allows adjustment.
How it felt to ride & my overall reaction.

Adding a cool blue Instructor platform will be de rigueur for any studio with Blade Ions
Let me start by saying Star Trac makes a phenomenal Indoor Cycle. Solid and smooth – I'm sure Jeff Wimmer had his hands on these. They fit me perfectly – or after riding & teaching on them for all these years do I fit them perfectly? Either way they're very nice to ride… and you hear the yeah-but coming… but I've really become a fan of magnetic resistance over the past 4 years. I understand how Spinning's® brand goes to the “feel” of a Spinner® and that “feel” comes in part from a friction based resistance system. I prefer riding magnetic and was disappointed that the Ion still uses a friction brake.
I also felt weak/less powerful on the Spinner Blade Ion. Or said differently, for a given amount of effort, I was seeing a lower wattage number than I'm used to seeing from a recently calibrated FreeMotion or a Schwinn AC. You could add embarrassed to my list of feelings. I actually felt compelled to cover my readings while Josh was off the bike checking in with his class 🙁
Thinking it may just be me, I went directly to FreeMotion's area and jumped into a class with Cameron Chinatti. Nope, it wasn't me. There on a familiar cycle, I was seeing/feeling my normal ~250 FTP. So back to the Ion (different bike this time) but the same results. A similar effort/HR and only saw ~180 watts.
I talked to Angie about this and she suggested that you just can't compare the two, they're different. I've asked Angie to join me on the Podcast to discuss this in detail and will let you know if/when she'll come on as a guest.
Later that morning I also tried a little experiment that I've wanted to do for years…
What happens to your Power / Wattage when you accelerate from a set point, say; 100 watts @ 60 rpm to 90 rpm on friction based system, as compared to a magnetic system? Do they react the same way?
You can read my follow up article to learn more: Comparing Spinning’s® Friction to FreeMotion’s® Magnetic Resistance
Stay tuned for the results + some thoughts on Spinpower™ later this week.
[/wlm_ismember]
Originally posted 2013-03-24 11:20:19.
by Gino | Nov 22, 2019 | Instructor Training, Master Instructor Blog, Training With Power

Coach Gino gets an assist from a professional statistician.
Let’s Try This Another Way
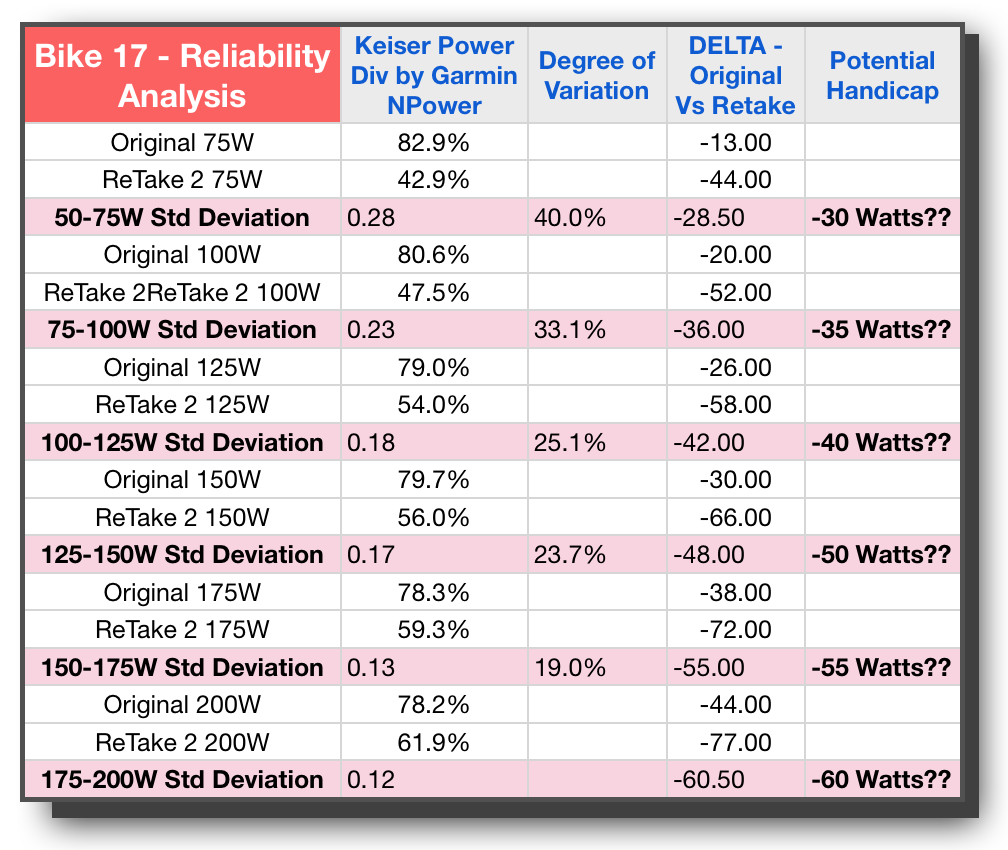
After testing 14 different bikes, with 6 of them also being repeat tested at least twice, I was pretty disappointed to see the data I reported in our last blog. This was never meant to be just an academic exercise. This had pure practical motivation. I wanted to be able to do real and reasonable competition in class. I wanted to encourage more tantalizing trash talk among my most competitive riders. I wanted to let some of my “little old ladies” throw it down against some of the guys who think bigger is better. I needed the bikes to be on an even scale to do this in good conscience, and handicapping them against a reputable objectively measured power meter seemed like a no-brainer to do just that.
But alas, the numbers from my work up to this point lead me to a conclusion I simply had not anticipated; that each bike within itself may vary day to day with regards to what power it will display given the same force being applied. This was an assumption that myself and many other “defenders of calculated power” have held on to for these past 4 years or so – that it doesn't really matter if the power is accurate compared to what would be measured with a real power meter, as long as that power was consistent. In other words, we could know if our training was making us better or not by pre and post testing on the same bike. It would simply generate a relative value so we could know if we improved a lot, a little or not at all. Each year at Winter Training we would assign bikes so that we could be assured of this “fact”. This was indeed the fundamental assumption that prompted the entire notion that a handicap could indeed be created, if we had a objective way to get at power simultaneous to seeing the bike's power display.

Unfortunately, as you could see from the numbers reported the last time, they varied so much within the same bike, from one testing episode to the next (even despite painfully recreating the same circumstances of a consistent rider, environment, time of day, method of execution and all the like), that this assumption was not true for at least 50% of the bikes. Undaunted by this surprisingly sad turn of events, I started to ask around for an available statistician that might be interested in this research. I wanted a more experienced extra set of eyes and less personally invested perspective so that they could let me know if I am doing something wrong. Was I measuring the wrong way, perhaps working with false assumptions, not controlling enough variables, etc. I didn’t want to give up just yet — I had already invested too much time and energy.
3 More Bikes Tested, 3 Times Each
One of my regulars referred me to Sarah who is both a cyclist and teaches statistics at a nearby university. We met a couple of times to discuss what I had done so far, and she spent some time and thought on the issue, and created a new protocol. We would focus on just 3 bikes, took them out of commission so no one else would ride them, made sure she conducted/directed me as I rode/tested each bike. These trials would be done on three different days, in random order as generated from a random table of numbers. This video takes us through one of those three sessions.
In the next blog post, we will discuss the results of these 9 trials.
http://vimeo.com/82319421
Indoor Cycling Power Accuracy & Validation Research from Cycling Fusion on Vimeo.
Originally posted 2014-02-19 03:04:24.
by John | Oct 3, 2019 | Instructor Tips and Tricks, Instructor Training, Training With Power

How steep is a 4% grade? 8%? Over 10%?
How do I effectively explain % of grade to my class?
What are the feelings I would experience climbing different % grades on a bicycle?
And finally, how do I effectively communicate that feeling to my class?
Every July we hear commentators Phil Liggett, Paul Sherwin and Bob Roll discuss how the Tour de France is won or lost in the mountains. Just winning one of the popular climbs; Alpe d'Huez, Mont Ventoux, Col du Tourmalet or others can be the highlight of any cyclists career. But when Liggett explains that Alpe d'Huez has an average grade of 8% what exactly does that mean? Based on context, we can assume that this is a very difficult climb… but how difficult? What does it feel like to ride with the professional Peloton as everyone powers up a long climb at 8% grade?
So with the Tour only a month away and many Instructors and students riding outdoors, I felt you might benefit from some cliff notes on Grade and Slope. If you are reading this outside of North America, the concepts that I'm going to present are the same, but how they are noted on street signs varies from country to country.
Simply put, % Grade is gain in elevation (what's called the Rise), over a horizontal distance (the Run) – “typically” 100 feet or meters. The actual distance traveled is the Slope length which is slightly longer than the Run – it's that A²+B²=C² Pythagorean theorem thing you grew to love in highschool 🙂
So…
A 5% grade = a 5′ increase in elevation in 100′ of horizontal travel.

Image from Wikipedia
So you don't confuse the engineer's in your class, be careful not to mix up % of grade and the degrees of angle. They're completely different and roads aren't measured in °. If you feel it would be helpful to your students, you may want to comment that a road at 45° (as if that would be possible) would have a 100% grade, i.e. 100′ forward @ 100′ up.
Wikipedia has an informative page on Grade / Slope if you'd like to learn more.
Alpe d'Huez has an average grade of 8.1% over a run of about 13 km. Click to see the profile. That sounds impressive but it really tells you nothing if you don't understand what it feels like to ride a bicycle up an 8.1% grade. Actually 8.1% is the average. The first kilometer and a half are at over 10%.
If you want to clearly communicate the pain of climbing a 8.1% my suggestion is to find a steep hill, ride up it and experience what it feels like.
So now you may be thinking; “great idea John… but I don't recall seeing the grades marked any of the roads in my neighborhood.” My response would be; go out, find one and measure it.
I made the video below for a different project where I recommend that cycling studios measure and mark the road as a helpful guide to outdoor cyclists. In the video I describe the simple process of measuring the grade of one of the local climbs in your town.
If that went by to quickly, you divide the number of vertical inches by 120 (10′) which gives you the % grade.
How I communicate % grade in my classes.
Discussions of % grade typically come up when I'm teaching a virtual ride using an Epic Planet DVD or Global Ride's Dirty Dozen DVD, the grade of each climb is listed in the information bar at the bottom of the screen and I'll use it to help explain the intensity of each effort. I start by explaining that, although it doesn't sound like much, 4% is a serious climb that will have most of us at Threshold HR or Power FTP if it's of any length. I go on to explain that (at least where I live) most roads or highways rarely exceed 4%.
I'll reference local roads, that I understand the % grade, to my class – my apologies to those of you in flat lands of Iowa or Florida, you're on your own. Some of these roads, on established cycling routes, have steeper grades that I have measured. I'll talk about them by name; “Fox Road Turn” 8%, “Carver Wall” 12% and “Eden Prairie Road” 13.5% as a way to appeal to my cyclists who have experienced these climbs for real.
Other examples:
- 5% has you in your small chain ring (the sprocket in the front) and you need to manage (limit) your effort so as not to blow up!
- 8% and you're wishing you had a smaller gear and it's everything you can do to ride in a straight line. It's also everything you can do keep your pedal stroke smooth. Time here is short with your HR way over VT2 – Threshold.
- 10% is the limit of most recreational cyclists, if the climb is longer than a block or two. Smallest gear, out of the saddle and HR is as close to maximum as you can tolerate.
- 15% or more and you get off and walk 🙁
Once you've measured and ridden a climb with known grade, my guess is you're going to have a new appreciation for how truly difficult those famous climbs in the Tour de France really are and a new respect for the professional cyclists who climb them.
You can find the profiles of every climb, in every major Tour, along with 33,773 others at http://www.climbbybike.com/
Do you have any tough climbs near you?
Originally posted 2012-06-06 11:45:22.
by Gino | Aug 30, 2019 | Master Instructor Blog, Training With Power

It’s finally time to take a look inside.
First I have to apologize for taking almost 2 months to report on results that were secured after just 4 weeks of data collection. That’s part of the problem with Evidence Based Cycling; once you do herd all those cats on bikes (see last post) and send them on their way to collect data, you have to eventually herd them over again to retrieve the data. I only got the final piece of performance data last week.
I won’t hold you in suspense any longer, the results appear below in summary form — with the bottom line of: “What effect if any did this protocol or riding drill have?“ or perhaps more simply stated “Did we get an better?” or better yet, would it be more appropriately states as “can this protocol be used as a specific prescription for improving Muscular Endurance in cyclists?” Frankly, I want to know that for myself and my own riding, as much as I want to or need to know it for the riders I coach personally.
Summary Results
The summary results shown here simply compared the Baseline Test (our method for determining their power generation and sustainability levels at the start of the test) to their Performance Test that sought to measure the same thing, on the same bike, in the same manner. The results seem to suggest that this riding drill for improving Muscular Endurance works.
|
SUMMARY RESULTS
|
Muscular Improvement
|
Endurance Improvement
|
Efficiency Improvement
|
|
Average Change:
|
5.03%
|
3.35%
|
17.29%
|
|
Throwing out High & Low:
|
5.04%
|
5.04%
|
13.90%
|
The one fact that can, and often does bring seemingly good findings into question is the sample size. While we started with 11, we ended up with only 8 riders who completed the study. There are a variety of reasons for this, none of which had anything to do with the test itself. In any event, to be considered valid by almost any rigorous standard, this type of study would have to be repeated with a bigger sample size. May this preliminary “investigative type research” would inspire some budding graduate student in the physiological sciences to pursue a wider study.
Are The Results Statistically Significant?
In terms of whether we can consider these results meaningful or not, we must first introduce the term or phrase associated with this question; “statistical significance”. In regards to research findings, it has a fairly specific definition. Wikipedia explains it this way: “Statistical significance” is a statistical assessment of whether observations reflect a pattern rather than just chance…” It further defines the level or degree of significance this way: “The choice of significance level is somewhat arbitrary, but for many applications, a level of 5% is chosen by convention.[3][4]”
As you can see from the summary results, by all accounts calculated, only the Average Change in Endurance would come into question. This is quite understandable given the fact that these results were assessed only 4 weeks after the study began. In training other athletes, and in training myself as a semi-retired racer, I can tell you that most real and lasting training effects take 6 weeks to be “established”; established as in the gains are likely to not be reversed any time soon, and that there was a real cause and effect relationship between the work and the result.
The Gory Detail
Below is the table with all the numbers that make up the summary findings above. Data geeks control yourself — these numbers only represent 4 weeks of following the M.E. protocol, and we need much more data to begin to think of implications beyond the obvious conclusions drawn from what we see here. That will be the focus on our next blog post — what all can we see and say about this data and its implications for both training and further research.

Click image to enlarge
Stigler S (2008). “Fisher and the 5% level”. Chance 21 (4): 12. doi:10.1007/s00144-008-0033-3.
Fisher RA (1925). Statistical Methods for Research Workers (first ed.). Edinburgh: Oliver & Boyd.
Originally posted 2012-10-24 11:49:24.

by John | Apr 23, 2019 | Big Box Instructor, Instructor Training, KEEPING IT FUN, Master Instructor Blog, Spotify, Training With Power

With 40°f and rain scheduled for this past Sunday, I agreed to sub the 9:00am Cycle Sculpt class at the Life Time Fitness where I have scheduled classes. This was my third chance to teach this LTF branded format that combines Indoor Cycling and Resistance training. You can read about my earlier experiences here and here – both links include my class profile and Spotify playlist.
I was chatting with my friend Richard in the locker room before class. He has taken my cycling classes for years and he's front & center for this class religiously. He also knows something about training physically and mentally – Richard's a triathlete and Tae Kwon Do Grand Master with 9th Degree Black Belt. I told him how I rarely feel anxious before any class, but these cycle sculpt classes always make nervous.
Do you have any suggestions? I asked.
Just relax and do what YOU normally do…
Just relax? That's it? That's your suggestion?
Richard went on to explain; I haven't seen the John I know up on that bike, the other times you've lead this class. You need to lighten up man and just be you. Show us that you're having fun, work us hard and we'll all be happy!
Truer words were never spoken
As soon as Richard finished speaking I knew exactly what was wrong. Two things actually:[wlm_private ‘PRO-Platinum|PRO-Monthly|PRO-Gratis|PRO-Seasonal|Platinum-trial|Monthly-trial|PRO-Military|30-Days-of-PRO|90 Day PRO|Stages-Instructor|Schwinn-Instructor|Instructor-Bonus|28 Day Challenge']
- I was trying too hard to make everything fit together. I had decided that the music, movements and transitions all had to flow together perfectly = the anxiety I felt before and during the class. I can remember panicking early in the last class I subbed when I heard the currently playing song crossfading to the next > Crap – they're not done with their exercise yet! This messed up my perfectly choreographed class and shortened the time available (and needed) for next activity… everything snowballed downward from there.
- I wanted (needed?) everyone to like me and my class. I've been at this game for a long time and normally feel very confident subbing any class. Why, all of a sudden, am I now feeling insecure and looking for approval? Because these people don't normally come to my class. That's why. I realized that I was trying to be someone different in order to appeal to a group of people whom I assumed don't come to my other classes because they don't like me.
Separating their like/dislike of ME from a like/dislike of MY CLASS
After 9 years at LTF, I'm well known as the Instructor who teaches a very cycling specific class. Believe it or not, there are a lot of members who don't like that format. That's why they don't come. It isn't that they don't like ME, just my heavy emphasis on outdoor cycling. So after 30 seconds of self-talk while I walked to the studio, I had a new perspective – the proper perspective to lead the class confidently and it appeared that most participants enjoyed it 🙂
End note: After the class I was told by a member how she appreciated that I included the weight segments. She explained that a previous sub had refused to offer anything but cycling > which confirmed my new perspective (it's not ME they dislike) and I felt awesome knowing that I delivered a class very close to what these participants came for!
Evolution Cycle/Sculpt Profile #3
To keep this class more familiar to me, I switched my plan and followed our typical Evolution Cycling format through the first four tracks.
Equipment: Everyone needs hand weights = 12/15 Reps to failure and a floor mat.
This light between us 5:09 Warm up where we transition to a standing run after just a few minutes. Every minute after we sit, increase a few gears and then up again. NOTE: Cycle Sculpt includes a lot of standing work & jumps. Frequent variation is important = if you feel you've been doing something for too long, you probably have and need to change.
Revolution 5:09 Openers – I like to have everyone find a comfortable cadence and add load until they feel the need to stand. Each of 4 openers is a standing acceleration that's maintained for a progressively longer effort. Start with 15 seconds and add ten seconds each time. The goal is to get to threshold by the end of the last 45 sec effort.
Daybreak 5:04 Best Effort – This track has a long intro that lights off at exactly 1:00. I used that as a recovery after the openers. Sunday we recorded our Best Effort distance over three minutes. This is all out, absolute maximum sustainable power, from start to finish.
Remind everyone to remember both their miles traveled and Avg. Watts (if you have them) or average HR at the end. We'll be referencing these metrics later.
Runaway Baby 2:28 Reset – Resets are a short transition song, part recovery part just plain fun! Here I offer an option to either recover completely, or find a productive effort around VT1 – edge between Zone 2 & 3 in a five zone system.
Tribal Force 8:01 Floor set #1 – With only 12 participants, we had plenty of room in the front for everyone to have a mat. While standing we did: 10 x DB curls, 10 x DB OH press, 10 Pushups and 10 situps/crunch > repeat. These are all at self directed tempo and with 8 minutes there's plenty of time.
The few who choose to stay in saddle were instructed to find a comfortable climb and alternate seated and standing at their discretion.
Spectrum 5:01 Jumps on a climb – @62 RPM, this track has a very strong beat begins around the one minute mark. Use the intro to get everyone back on and settled, then build the hill – again to that point where they feel the need to stand. Follow the phrasing of the music first at 8 count, then 4 count jumps. It's super important that you can properly demonstrate these jumps exactly with the music. I'll start by calling out the count; up, two,three,four, down, two three four (or out to eight). Then get quiet and just watch them, watching you. If you see some struggling, go back to the basics of seated pedaling to the music. Rinse & repeat.
Until we go down 4:12 Floor set #2 Compound movements: 20 Squats/OH press and then alternating leg lunges with curls – 8 each leg.
Animals 5:04 Pick your head up – You're off the back! – this seated climb replicates the panic you feel when riding in a group, with your head down… only to raise it up and see you've slipped off the back. Have your riders find the 64 RPM pedal speed and then add the hill that has them thinking they should stand. There are a number of changes in the music (a great one at 1:50) that become your trigger to pick your head up, realise what's happened and then stand, accelerate and sustain the effort to fight to get back on. You'll find natural breaks that will have these efforts ~ 30 seconds. Perfect for a few brief trips to threshold.
Police and Thieves 6:10 Floor set #3 Floor work 2 sets of 20 pushups (using weights as support) and 20 crunch/sit-up.
Riders are following the 77 RPM cadence with a strong endurance (just below threshold) Time Trial pace.
Show Me 3:28 Reset Easy pace, taking time to drink, towel off and prepare mentally for the last hard effort of the class.
Ready to go 5:01 Big finish Time to replicate that earlier Best Effort – or better it if possible. This track as a nice, 30 sec building into where you'll be encouraging everyone to get back to their previously remembered watts or HR. Hit the stage button and see how far you can get over the next three minutes… or sustain that VT2 threshold HR over the timed section. [/wlm_private]
It's the end of the world 4:07 Warm down – my preference is to give athletes a chance to warm down = a gradual recovery vs. just soft pedalling. The cadence of ITEOTWAWKI is a tick over 100 RPM. Get there and then add enough resistance to keep yourself aerobic (around VT1) for the first three minutes and then slowly dial it back until everyone is conversational > that's your cue as the Instructor that everyone has recovered 🙂
1901 5:11 Stretch