It”™s finally time to take a look inside.
First I have to apologize for taking almost 2 months to report on results that were secured after just 4 weeks of data collection. That”™s part of the problem with Evidence Based Cycling; once you do herd all those cats on bikes (see last post) and send them on their way to collect data, you have to eventually herd them over again to retrieve the data. I only got the final piece of performance data last week.
I won”™t hold you in suspense any longer, the results appear below in summary form — with the bottom line of: “What effect if any did this protocol or riding drill have?“ or perhaps more simply stated “Did we get an better?” or better yet, would it be more appropriately states as “can this protocol be used as a specific prescription for improving Muscular Endurance in cyclists?” Frankly, I want to know that for myself and my own riding, as much as I want to or need to know it for the riders I coach personally.
Summary Results
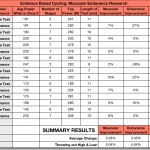
The summary results shown here simply compared the Baseline Test (our method for determining their power generation and sustainability levels at the start of the test) to their Performance Test that sought to measure the same thing, on the same bike, in the same manner. The results seem to suggest that this riding drill for improving Muscular Endurance works.
|
SUMMARY RESULTS |
Muscular Improvement |
Endurance Improvement |
Efficiency Improvement |
|
Average Change: |
5.03% |
3.35% |
17.29% |
|
Throwing out High & Low: |
5.04% |
5.04% |
13.90% |
The one fact that can, and often does bring seemingly good findings into question is the sample size. While we started with 11, we ended up with only 8 riders who completed the study. There are a variety of reasons for this, none of which had anything to do with the test itself. In any event, to be considered valid by almost any rigorous standard, this type of study would have to be repeated with a bigger sample size. May this preliminary “investigative type research” would inspire some budding graduate student in the physiological sciences to pursue a wider study.
Are The Results Statistically Significant?
In terms of whether we can consider these results meaningful or not, we must first introduce the term or phrase associated with this question; “statistical significance”. In regards to research findings, it has a fairly specific definition. Wikipedia explains it this way: “Statistical significance" is a statistical assessment of whether observations reflect a pattern rather than just chance...” It further defines the level or degree of significance this way: “The choice of significance level is somewhat arbitrary, but for many applications, a level of 5% is chosen by convention.[3][4]”
As you can see from the summary results, by all accounts calculated, only the Average Change in Endurance would come into question. This is quite understandable given the fact that these results were assessed only 4 weeks after the study began. In training other athletes, and in training myself as a semi-retired racer, I can tell you that most real and lasting training effects take 6 weeks to be “established”; established as in the gains are likely to not be reversed any time soon, and that there was a real cause and effect relationship between the work and the result.
The Gory Detail
Below is the table with all the numbers that make up the summary findings above. Data geeks control yourself — these numbers only represent 4 weeks of following the M.E. protocol, and we need much more data to begin to think of implications beyond the obvious conclusions drawn from what we see here. That will be the focus on our next blog post — what all can we see and say about this data and its implications for both training and further research.
Stigler S (2008). "Fisher and the 5% level". Chance 21 (4): 12. doi:10.1007/s00144-008-0033-3.
Fisher RA (1925). Statistical Methods for Research Workers (first ed.). Edinburgh: Oliver & Boyd.
Originally posted 2012-10-24 11:49:24.
- Me & My Big Mouth - April 18, 2024
- Indoor Cycling Power Research #7: Good News, Bad News - August 16, 2023
- Blog Post #10 Baseline& Performance Testing - June 29, 2023


I’m finding your data a little confusing… I’m not exactly sure what it is you’re trying to quantify and how you’re calculating the changes you observed. What exactly does 5% improvement in “muscular improvement”, “endurance improvement” or “efficiency improvement” mean? I can’t quite figure out where those numbers are coming from in the data you provided… Can you provide a little detail on what kind of testing protocol you used? From your table, what does “Power in Zone 3” mean? Heart rate zone 3? And what zones are you using (Friel?) It’s a little hard for me to follow what you’re presenting in your data table, but it looks like the data are all over the place – it’s hard to really find much of a trend there….
Thanks for the comments Jennifer – you’ve confirmed that I truly am learning how to blog – give enough information to keep them reading, and not enough so they have to keep coming back LOL! Seriously though, I planned on doing a deep dive into the data next post (next week, God willing.) thanks
Gino,
Thanks for the hard work.
I participated in the test, indeed I many of my classes did as well (though they did not know). I am a bit confused as well. It appears that this muscular endurance protocol produced improvements for all participants in the areas of muscular (strength?) and efficiency. Yet endurance (presumably what we were after) seems to have eluded four of eight and one poor soul went backward.
So, like Jennifer I’m looking forward to your follow up.