First I have to apologize for taking almost 2 months to report on results that were secured after just 4 weeks of data collection. That’s part of the problem with Evidence Based Cycling; once you do herd all those cats on bikes (see last post) and send them on their way to collect data, you have to eventually herd them over again to retrieve the data. I only got the final piece of performance data last week.
I won’t hold you in suspense any longer, the results appear below in summary form — with the bottom line of: “What effect if any did this protocol or riding drill have?“ or perhaps more simply stated “Did we get an better?” or better yet, would it be more appropriately states as “can this protocol be used as a specific prescription for improving Muscular Endurance in cyclists?” Frankly, I want to know that for myself and my own riding, as much as I want to or need to know it for the riders I coach personally.
Summary Results
The summary results shown here simply compared the Baseline Test (our method for determining their power generation and sustainability levels at the start of the test) to their Performance Test that sought to measure the same thing, on the same bike, in the same manner. The results seem to suggest that this riding drill for improving Muscular Endurance works.
SUMMARY RESULTS
Muscular Improvement
Endurance Improvement
Efficiency Improvement
Average Change:
5.03%
3.35%
17.29%
Throwing out High & Low:
5.04%
5.04%
13.90%
The one fact that can, and often does bring seemingly good findings into question is the sample size. While we started with 11, we ended up with only 8 riders who completed the study. There are a variety of reasons for this, none of which had anything to do with the test itself. In any event, to be considered valid by almost any rigorous standard, this type of study would have to be repeated with a bigger sample size. May this preliminary “investigative type research” would inspire some budding graduate student in the physiological sciences to pursue a wider study.
Are The Results Statistically Significant?
In terms of whether we can consider these results meaningful or not, we must first introduce the term or phrase associated with this question; “statistical significance”. In regards to research findings, it has a fairly specific definition. Wikipedia explains it this way: “Statistical significance” is a statistical assessment of whether observations reflect a pattern rather than just chance…” It further defines the level or degree of significance this way: “The choice of significance level is somewhat arbitrary, but for many applications, a level of 5% is chosen by convention.[3][4]”
As you can see from the summary results, by all accounts calculated, only the Average Change in Endurance would come into question. This is quite understandable given the fact that these results were assessed only 4 weeks after the study began. In training other athletes, and in training myself as a semi-retired racer, I can tell you that most real and lasting training effects take 6 weeks to be “established”; established as in the gains are likely to not be reversed any time soon, and that there was a real cause and effect relationship between the work and the result.
The Gory Detail
Below is the table with all the numbers that make up the summary findings above. Data geeks control yourself — these numbers only represent 4 weeks of following the M.E. protocol, and we need much more data to begin to think of implications beyond the obvious conclusions drawn from what we see here. That will be the focus on our next blog post — what all can we see and say about this data and its implications for both training and further research.
The information below is from my upcoming book Ride Inside which will be published by VeloPress and Available on shelves in late November 2019
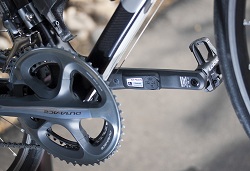
The Power Meter
When looking at the intensity of exercise, especially in the world of cycling, power is the ultimate metric. As we will explain later in Chapter 9, there are times where heart rate is a better metric to use, but overall all, cyclists must train using power to get better, faster and stronger. As we said above, the heart rate’s biggest downside can be it greatest advantage. Conversely, power’s biggest advantage can be it largest downside. Power is an absolute number, unchanging due to external factors that affect your life (sleep, stress, diet, emotional stability and more).
While many view this as a plus, it can be all too easy to
implode during a race or very hard ride because you are trying to maintain a
power number that your body is physiologically not able to maintain that
particular day, regardless of your training.
So, what is power? Power is simply how much work you are
doing on the bike. Power is measured in watts. The definition of a watt, from https://www.merriam-webster.com, is “the
absolute meter-kilogram-second unit of power equal to the work done at the rate
of one joule per second or to the power produced by a current of one ampere
across a potential difference of one volt : ¹/₇₄₆ horsepower.”
Most of the tools we have looked at in writing this guide
can provide you with power numbers, or have the capability to do so: trainers,
indoor bikes and outdoor bicycles. Before we look at how those devices generate
that data, you need to understand that most power numbers are an estimated
value. This is a large area of contention currently in the indoor cycling market:
if the power number on the bike is calculated or measured, but please know that
all power displays on indoor bikes, and the power meters on outdoor bikes, estimate
the data based on measurements and algorithms. What this means to you, the
rider, is that you should attempt to use the same equipment each time that you train
so that your data is consistent. The more serious you are about measuring your
gains the more important this becomes.
How is Power Calculated
As mentioned above, power is the
amount of work or energy that is being produced. The only true way to measure power
is through the use of a dynamometer, or "dyno" for short. A dyno
itself actually calculates the power data by simultaneously measuring torque
and rotational speed (rpm). This is the type of measurement that most sports
science labs utilize and this is the measurement that most bicycle power meters
use to calibrate and rate their performance.
Most indoor bikes and outdoor bicycles
use power meters that are constructed utilizing one or more strain gauges or
load cells. In short, from https://www.merriam-webster.com, “a
strain gauge is a device that consists
of a fine wire firmly bonded to thin paper and that when attached to an object
subjected to stress indicates minute changes in strain by corresponding changes
in electrical resistance of the wire as it is likewise elongated.” To truly understand
a strain gauge, we looked to Omega Engineering (https://www.omegaeng.cz/prodinfo/straingages.html):
A Strain gage (sometimes refered
to as a Strain Gauge) is a sensor whose resistance varies with applied force;
It converts force, pressure, tension, weight, etc., into a change in electrical
resistance which can then be measured. Stress is defined as the object's
internal resisting forces, and strain is defined as the displacement and
deformation that occur.
For a more indepth explanaition
we look to Omega Engineering (https://www.omegaeng.cz/prodinfo/straingages.html):
Today, the typical power meter uses metal-foil strain gages. The metallic
foil-type strain gage consists of a grid of wire filament (a resistor) bonded
directly to the strained surface by a thin layer of epoxy resin. When a load is
applied to the surface, the resulting change in surface length is communicated
to the resistor and the corresponding strain is measured in terms of the
electrical resistance of the foil wire, which varies linearly with strain. Interestingly,
the most desirable strain gage materials are also sensitive to temperature
variations and tend to change resistance as they age. So the power meters should
be re-calibrated every so often to remain accurate, or at least as accurate as
they were designed.
In order to measure strain with a
bonded resistance strain gage, it must be connected to an electric circuit that
is capable of measuring the minute changes in resistance corresponding to
strain. Strain gage transducers usually employ four strain gage elements that
are electrically connected to form a Wheatstone bridge circuit. The output
voltage of the Wheatstone bridge is expressed in millivolts output per volt
input.
Wow, that is a lot of technical
knowledge. The most important take-away from all of this is that the power
meters that you find on bicycles, both indoor and outdoor, calculate power.
While you will use the power data to determine your training zones, and to
perform your actual training, what is actually important about that data is the
change in your numbers over the course of your training. What we mean by that
is that if you begin your indoor training cycle with an FTP of 230w and end the
cycle with an FTP of 260w you have gained strength, efficiency and endurance
over the cycle provided that you have used the same power meter (or indoor
bike) over that period and especially for starting and ending testing. While
there are libraries of information on power meter and indoor bike accuracy, the
delta in power from start to end is the bottom line. It is for this reason that
we advocate the use of a bicycle equipped with a power meter, which can be
paired with a Kinetic or Bkool trainer for E-Racing, for indoor training if you
are serious about continuing your power when you return to outdoor riding in
the spring.
Power Meter Features
We will take a look at the power applications
in Chapter 6, but for now, let’s look at the features that many power meters have.
In general, power meters are a measurement tool. That tool then needs to send the
data it calculates to some type of computer for storage and analysis. In most
cases, that computer is in the form of a cycling computer, such as a Garmin
Edge, Polar V650 or Wahoo Elemnt, or a sport (maybe multi-sport) watch such as
the Garmin Forerunner, Polar Vantage or Suunto Spartan. All of these computer
options have an amazing array of features and the ability to export or download
the training data to other programs that can sort and analyze that data to give
you unparalleled insight into your training and more importantly your strengths
and weaknesses. This data can be paired with heart rate data for a complete
view of your fitness level and progression.