I'm super excited to announce that ICI/PRO is teaming up with the owners of Full Psycle Indoor Cycling; Paul Harmeling & Shelly Scott. We are hosting our first Full Psycle/PRO Performance IQ Training on February 14th at the Full Psycle Studio in the Lincoln Park area of Chicago, IL.
1/20 update: There's just two open seats remaining.
I've taken over a dozen classes that incorporate PIQ Display Training – at studios across the country. In only one did I feel like the Instructor really understood how to effectively integrated PIQ into the class. That class was Paul Harmeling's and you now have the chance to learn from the person I see as the expert in teaching Display Training Indoor Cycling classes!
Can't make this workshop? If you would like to receive notifications of future events join this email list.
Listen to this short interview with Paul, where we discuss the details of the training we're providing February 14th.
This 6 hour, comprehensive training workshop will include two complete master classes. They'll be taught by Paul Harmeling & Shelly Scott – co-owners of Full Psycle.
To complement the Master Classes, we will be offering the following:
Understanding the basics of PIQ – presented by Tae Yoo
Troubleshooting and Best Practices
Training With Power for Indoor Cycling Classes – presented by Me John Macgowan 🙂
Maximising the functionality of Performance IQ and effectively class presentation using:
Power Screen/Race Mode
Heart Rate Training Screen
PTP (Personal Threshold Power) Screen
Watts/Lb – Weighted/Leveling/Handicapping Mode
Teams Screen
Building Entertaining Display Training Class Profiles
Creating Speciality Classes with PIQ
Get people excited about Display Training with Social Media
Using PIQ data to bring consistency to your Indoor Cycles
We are limiting attendance so we can include multiple opportunities for participants to demonstrate what they've learned. Instructors will need to conduct teach-backs throughout the workshop.
Tae Yoo is taking us all out for dinner Saturday night as the end of a great day of PIQ!
As a nutritionist, I hear many clients say they want to lose weight — to look better, have more energy, improve their health. But losing weight can also help you increase your power on the bike.
Ratios intrinsically provide two ways to improve the ratio — by manipulating either variable. The results of improving both variables can be dramatic.
As covered in a previous post, efficiency — the ratio of work output to expended energy — can improve with increased work output or decreased energy expenditure (or both).
In the same way, your power-to-weight ratio on the bike (measured in watts per kg) can improve with increased power or decreased body weight, or both.
Power is itself another ratio, of work to time. If work increases or time decreases, the result is greater power. ICI/PRO is currently covering this topic in depth.
So that provides 3 variables in the power-to-weight ratio: increase your strength (work), increase your speed, or decrease your body weight (or all of them).
Why Lose Weight?
Even if you’re not overweight, weight loss may improve your power-to-weight ratio. It need not — and shouldn’t — involve a strict “diet” that leaves you hungry most of the day.
It does involve careful monitoring of your numbers — how many calories you burn (using your power meter or, preferably, a wearable calorie counter 24 hours a day), and your calorie intake.
The goal is to eat fewer calories per day than you burn, but not by much, just 150 to 300 calories. If that feels too restrictive, drop the deficit to 100 calories. The result would be a slow decrease in weight that you can stop or reverse at any time.
These days, the general recommendation for weight loss is rapid loss. (Is that to match up with HIIT and the shorter-and-harder approach to fitness, I wonder?) Rapid weight loss is said to keep the “loser’s” motivation high.
Yet gradual weight loss — while also training for power — has the advantage of maintaining fat-free mass (FFM) so you won’t lose strength, an important variable in the power ratio.
Holding On To FFM
Weight loss often decreases muscle mass, especially rapid loss. But in the long-running (13-plus years) weight-loss program for which I was both the nutritionist and a training coach, we typically saw steady or increased FFM while the participants lost weight at a slow, sustainable rate.
That helped them maintain strength and power so they could do the training, which was frequently high-intensity. The intense training, of course, was designed to increase strength and power.
Maintaining FFM also prevented participants from having to drop calorie intake more and more (and more) for continued weight loss.
Don’t Bonk
Make sure you don't restrict calories on the ride itself. Whether you’re riding outdoors or doing tough power training in the studio, under-fueling before or during the ride could cause you to bonk.
Even without bonking, you may still feel week and have difficulty working up to your capacity — the power you’re trying to improve. Fuel as usual while riding.
Keep the calorie restriction small. Cut back a little more on days that you’re not training hard, or at least save the restriction for after the ride. If your power ride is late in the day, early A.M. calorie cutbacks may work. Just keep your pre-ride meal about the same as usual, and eat or drink whatever you need on the bike.
Be strict about post-training refueling (covered in a previous post) so you can train well the next day.
Technique and Efficiency
In all of this, don’t forget that better technique on the bike will help you waste less energy by reducing the energy needed for pedaling, reducing energy lost as body heat, and retaining more energy for your next pedal stroke. Your functional strength, a power variable, will increase.
Combining good technique, all the power training tips you’re currently getting here on ICI/PRO, and gradual weight loss will help you dramatically increase your power-to-weight ratio on the bike.
“Danny, Dakota and the Wishing Well” by A Silent Film
“Can't Hold Us” by Macklemore & Ryan Lewis
“Vertigo” by U2
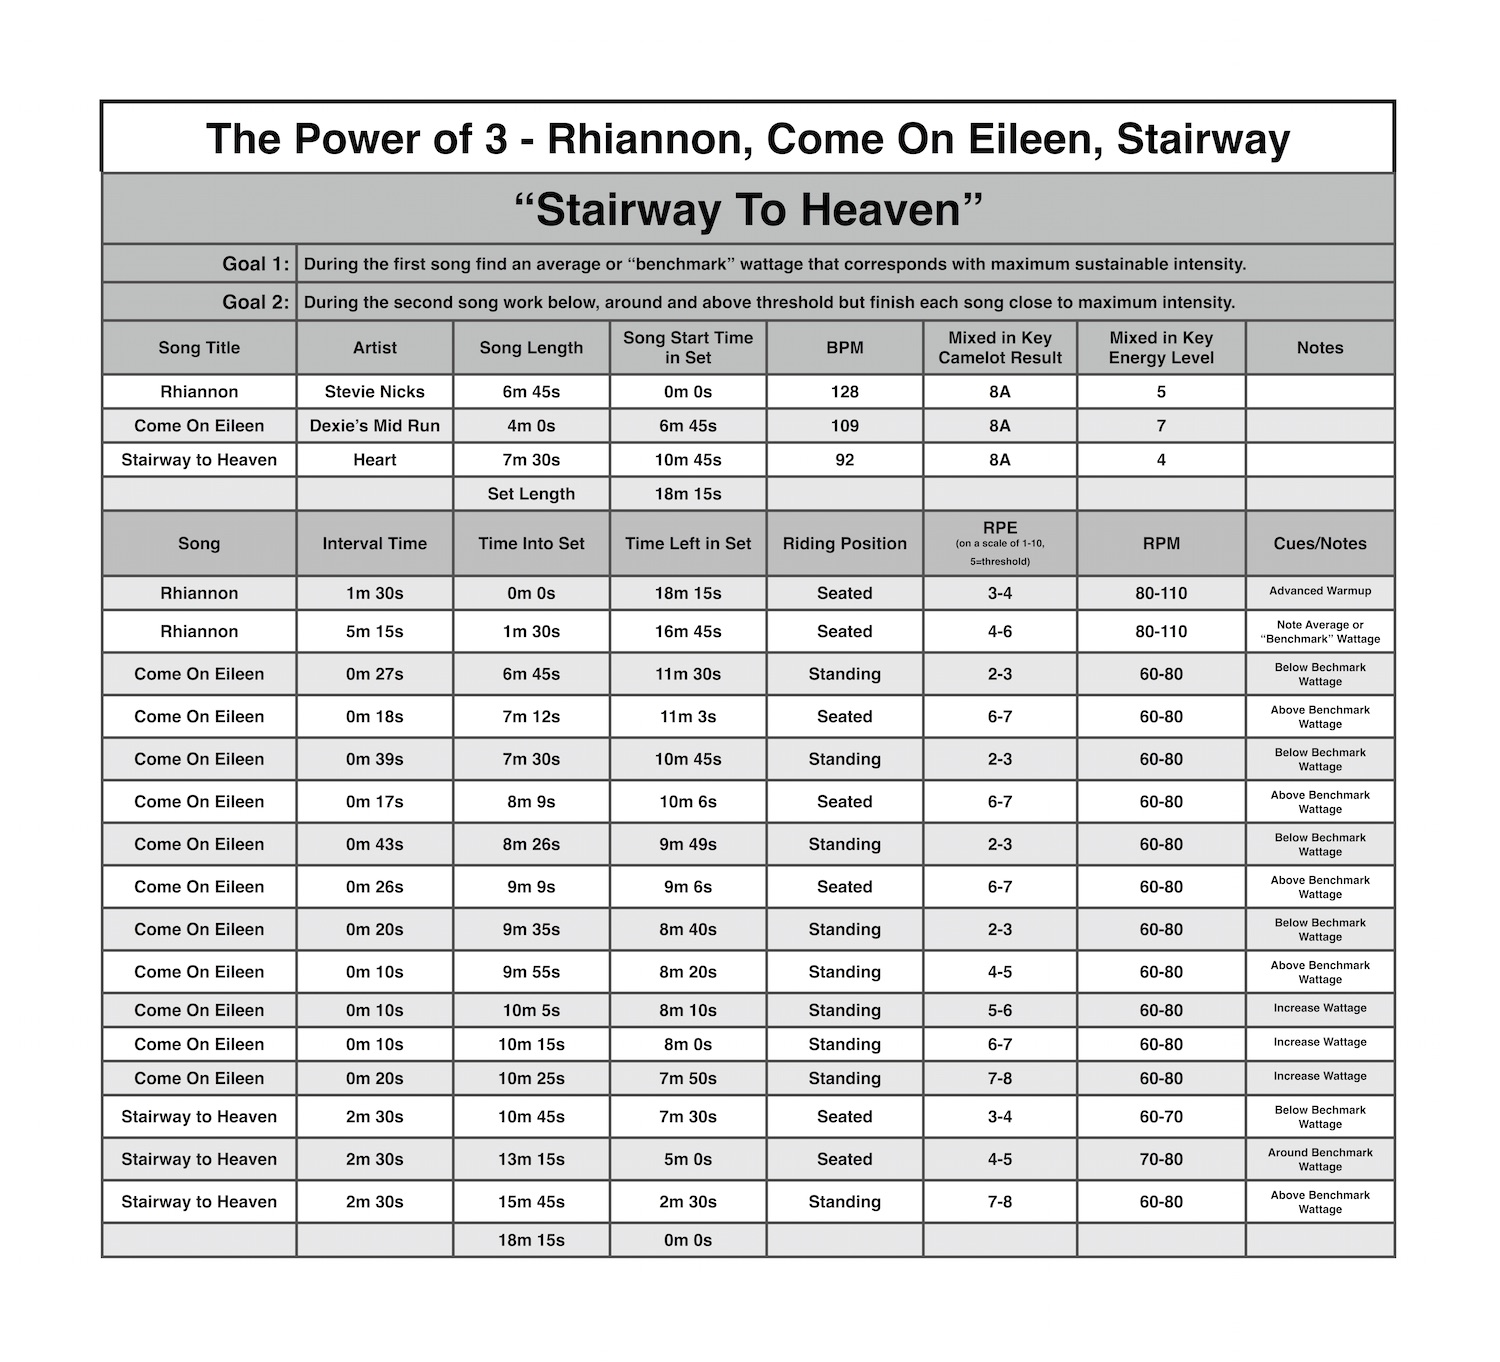
Last week I wrote about the “Threshold Check” or “Mini-Threshold Test” that I perform at the beginning of every class. This week I want to share how I teach the full 20 minute FTP (Functional Threshold Power) Test. With this post I have also included the playlist and video I use as well as a recording of me teaching an entire FTP class.
[wlm_private ‘PRO-Platinum|PRO-Monthly|PRO-Gratis|PRO-Seasonal|Platinum-trial|Monthly-trial|PRO-Military|30-Days-of-PRO|90 Day PRO|Stages-Instructor|Schwinn-Instructor|Instructor-Bonus|28 Day Challenge']If you are lucky enough to be teaching on bikes with power I believe it's important to use this technology and all the available metrics to their fullest capacity. I find the most powerful use of a power meter is in finding one's maximum sustainable wattage or threshold. Threshold is that state of equilibrium between high intensity exercise and the body's ability to buffer and filter the waste products produced by this intensity. With a power meter we can find a wattage number that correlates with this state of equilibrium or your FTP (Functional Threshold Power).
Exercise physiologists have devised many different ways to find one's threshold, but I have found the simplest and cheapest technique is to perform a 20 minute effort at maximum sustainable intensity. At the end of this 20 minute effort take note of the average wattage and multiply it by 95% and this number is your FTP. I'll go into greater detail on how to use this number in later posts, but now let's go over how to perform the FTP Test.
I like to have my riders warm up for a minimum of 15 minutes. I'll have them slowly increase their intensity for 10 minutes then I like to have them perform 3-4 one minute “pickups” increasing their intensity each interval while recovering for one minute after each. After a short, 3-5 minute, active recovery from the pickups I have the class perform a maximum effort 5 minute interval. This effort ensures that the lactate buffering and clearance systems are turned on and ready for the 20 minutes test that follows. I also have class participants remember their average wattage for this 5 minutes, it's a good number to refer back to when doing above threshold intervals. After another recovery, about 10 minutes long, we are ready for the 20 minute FTP test. Make sure all your participants know how to reset the bike console so they can get a new average for the 20 minute interval to come. Tell them that this is a very simple test, you want them to ride at the highest possible wattage for 20 minutes. Your job as the instructor is to motivate, but not to talk too much. Let your riders “settle in” to their maximum sustainable wattage and their most efficient cadence and just let them ride. At the end of the 20 minutes make sure they remember their average wattage, multiply it by 95% and they have their Functional Threshold Power. This “Benchmark” test is also great to see improvement over time, with proper training FTP should continue to improve.
Let me know how it goes, my classes love FTP days! They work so hard every day and once a month they get to see the payoff for all sweat and suffering.
6 song harmonically mixed FTP track , to download Right Click > Save As / Save Target As to download. Open in iTunes and then you'll see this in your Spotify Local File folder.
For years I had been patiently waiting for the facilities I instruct in to upgrade their bikes to use power. When these upgrades finally started to happen I was surprised by the different wattage readings I would see, not only, from different brands of bikes but by bikes built by the same manufacturer. I had always assumed a watt is a watt the same way a MPH is MPH or an RPM is an RPM. At first this was VERY disappointing, I have a very technical teaching style and I was hoping to have all my class participants perform a Functional Threshold Power (FTP) Test every 6-8 weeks, calculate their personal power zones and coach each and every class to those zones. Unfortunately, if every bike in the studio reads wattage, even a little bit, differently I would need to adjust my teaching style.
[wlm_private ‘PRO-Platinum|PRO-Monthly|PRO-Gratis|PRO-Seasonal|Platinum-trial|Monthly-trial|PRO-Military|30-Days-of-PRO|90 Day PRO|Stages-Instructor|Schwinn-Instructor|Instructor-Bonus|28 Day Challenge']
I needed to figure out a way to use this new technology, even with it's faults, effectively to give my participants the best workout possible. I decided that the FTP test was still going to be an integral part of my programming and I would still perform this test every 6-8 weeks. I asked my class participants to find 2-3 bikes that they believe are similar in wattage readings and ride those bikes as often as possible. Small differences are ok, large ones make zone training impossible. I also needed a technique to “dial in” new riders, those who never performed the FTP and others who may be forced to ride an unfamiliar bike. I decided to start every class with a proper warm followed by a mini threshold test that I call a “Threshold Check”. This “Threshold Check” can last anywhere between 4-6 minutes and I ask class participants to ride at their maximum sustainable intensity or wattage for the duration of this short test. If the bikes are equipped with a console that will show average wattage I ask for the class to find their average wattage for this “Check”. If the bikes do not have a way of reading average wattage I ask the class to be aware of their wattage throughout the “Check” and choose a wattage that they believe is closest to their maximum sustainable wattage. If I'm teaching on a bike that is not equipped with a power meter I still perform this “threshold check” and i do my best to “anchor” effort with threshold RPE. I also like to “anchor” effort and RPE during the FTP . Most FTP tests last 20 minutes, so 10 minutes into a FTP effort I'll explain that the feelings participants are experiencing, slight breathlessness. burning sensation in the legs and the need to stay extremely focused or wattage will drop is how a threshold effort “feels” and I ask them to associate this feeling with whatever RPE number is used as threshold in the facility I'm teaching in.
Now that each participant has a threshold wattage or RPE to work with I break my profiles down into 3 zones: Above Threshold, Around Threshold and Below Threshold. Efforts that are Above Threshold (greater than 106% of threshold) can last up to 8 minutes, efforts around threshold (90-105% of threshold) can last up to 30 minutes and below threshold efforts (less than 90% of threshold) can last up to 3 hours.
Check out the recorded classes below to hear how I use this “Threshold Check” in a class setting.
3 song harmonically mixed track, to download Right Click > Save As / Save Target As to download. Open in iTunes and then you'll see this in your Spotify Local File folder.
A different approach with a professional researcher still produced mixed results
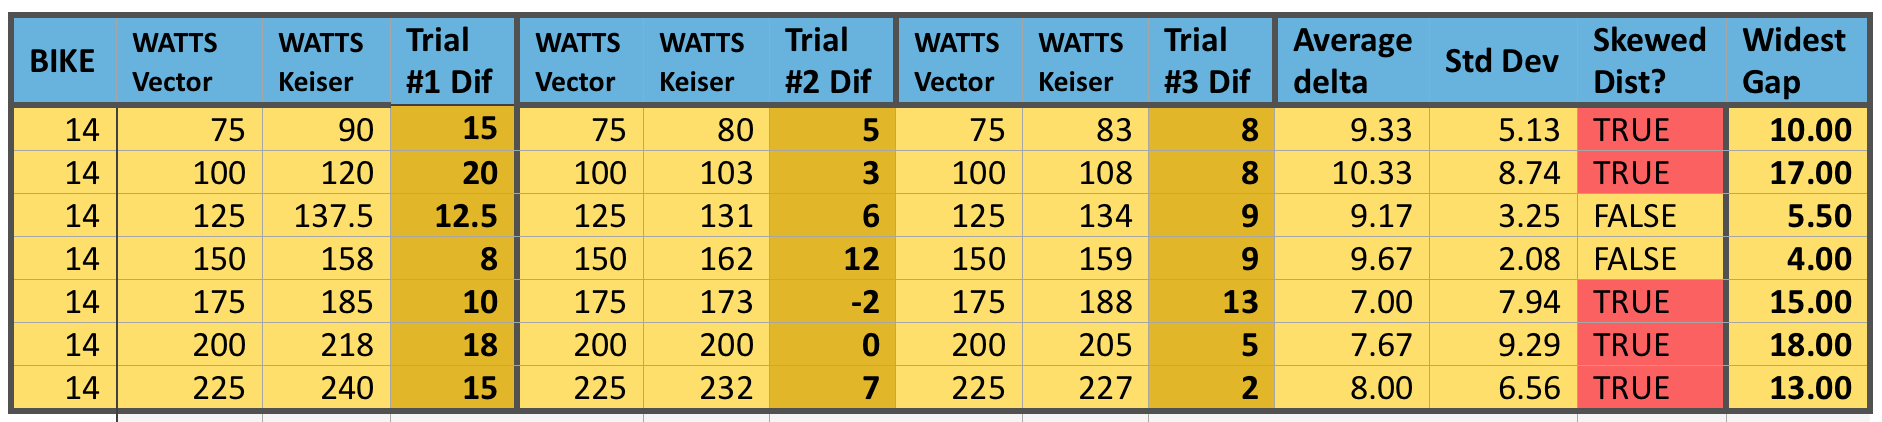
Let’s start with the good news. I’m sorry, I was completely pulling your leg. I really don’t have any good news. I know, that’s terrible — you can throw pencils and small farm animals at me next time you see me. I was really looking for the good news in these results and I just can’t find any. This last series of retesting the same three bikes to see if we could garner the same or similar results each time we measure the bike has led to 2 out of the 3 bikes demonstrating a “skewed distribution” of data. In other words, data that you could not and should not try to predict with because they are in a word, unreliable. That means my hope for creating a “handicap” for each bike to render them even and fair for comparisons and competitions is not possible.
Statistical measurements often use Standard Deviation to determine how much variation there is in the individual readings or occurrences of data (in our cases — the differences between the actual power and the measured power). There is something called the “Emperical Rule” (http://www.pmean.com/08/SdTooBig.html) “…it says that approximately 95% of the data lies between plus and minus two standard deviations of the mean.” This 95% rule is for data with a “normal distribution”. This is what we were hoping for when we measured the same bike several times.
Please remember, this stage of the research was RE-measuring the same bikes, not measuring the differences in power between bike computer and actual power of the power pedals. We knew all along the pure accuracy would not be there, we were simply hoping that the amount or degree to which it was “off” would be consistent.
So getting back to our “Empirical Rule”. There is a corollary to that principle, and that is “If a non-negative set of data (which we have with our power numbers study) has a standard deviation that is more than half of the mean, it is an indication that the data deviates substantially from a bell shaped curve. Almost always this is an indication of a skewed distribution.” The second column to the end (right side) indicates if the distribution of repeat, same bike readings has a skewed distribution or not.
Bike 14 tested 3 separate times, looking for consistency between tests, for reliability to set bike handicaps.
With bike #14, it is notable that Trial #2 and #3 area actually fairly close except for at the 175 Watt stage. However, when we add our first set of numbers to the analysis, all but two wattage levels are skewed. If we just consider 1 bike, we might make a case that if we were to do 5 to 10 repeat trials, we might see these better numbers continue. This was something Sarah (our statistician) suggested as a next possible phase of the research; to conduct a much higher number of trials to see if we begin to see greater consistency or normalcy to the data.
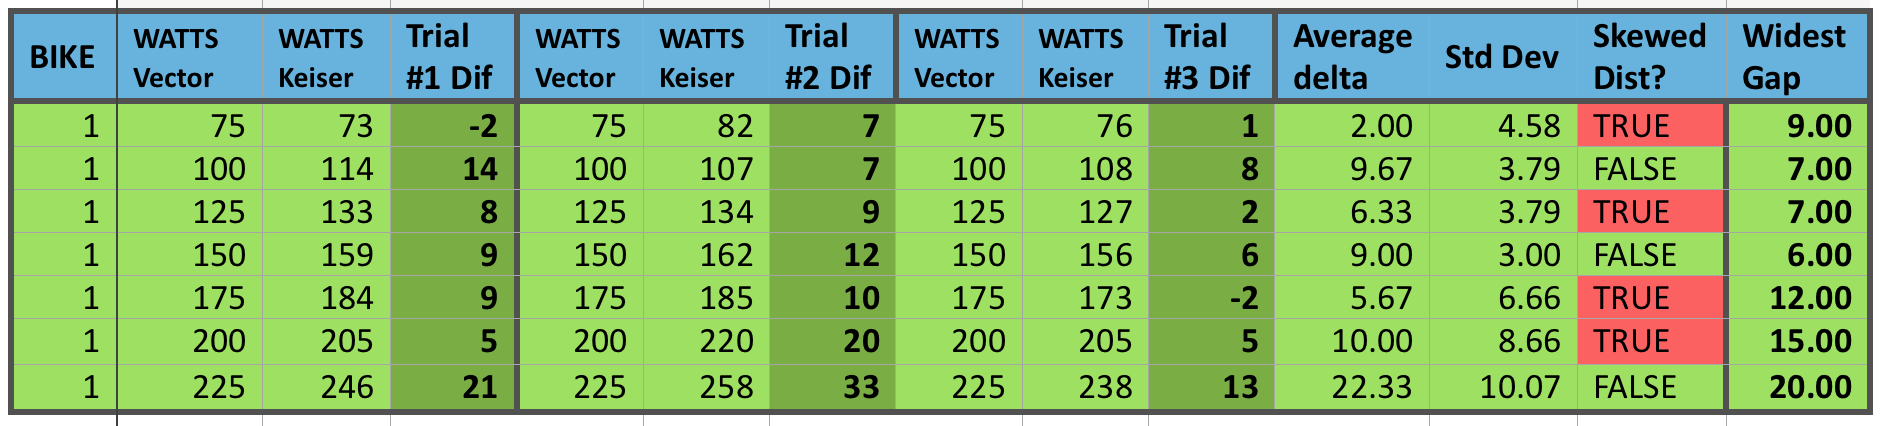
Bike 1 tested 3 separate times, looking for consistency between tests, for reliability to set bike handicaps.
Again, with bike #1 we have only 2 out of 7 different wattage stages that are not demonstrating a skewed distribution of data. At a “gut feel” level, I was hoping to see less than 5 watts difference between measurements of power when it was the same stage. I was willing to accept a difference of 10 watts since accuracy was still not the main driver here. However, again we must remember this is not the power difference, but just the repeating values on the same bike — how reliable it is for a consistent representation of power. Unfortunately, 30% of all the individual stages rendered differences greater than 10 watts and statistically 4 out of the 7 stages were considered skewed.
A Glimmer of Hope?
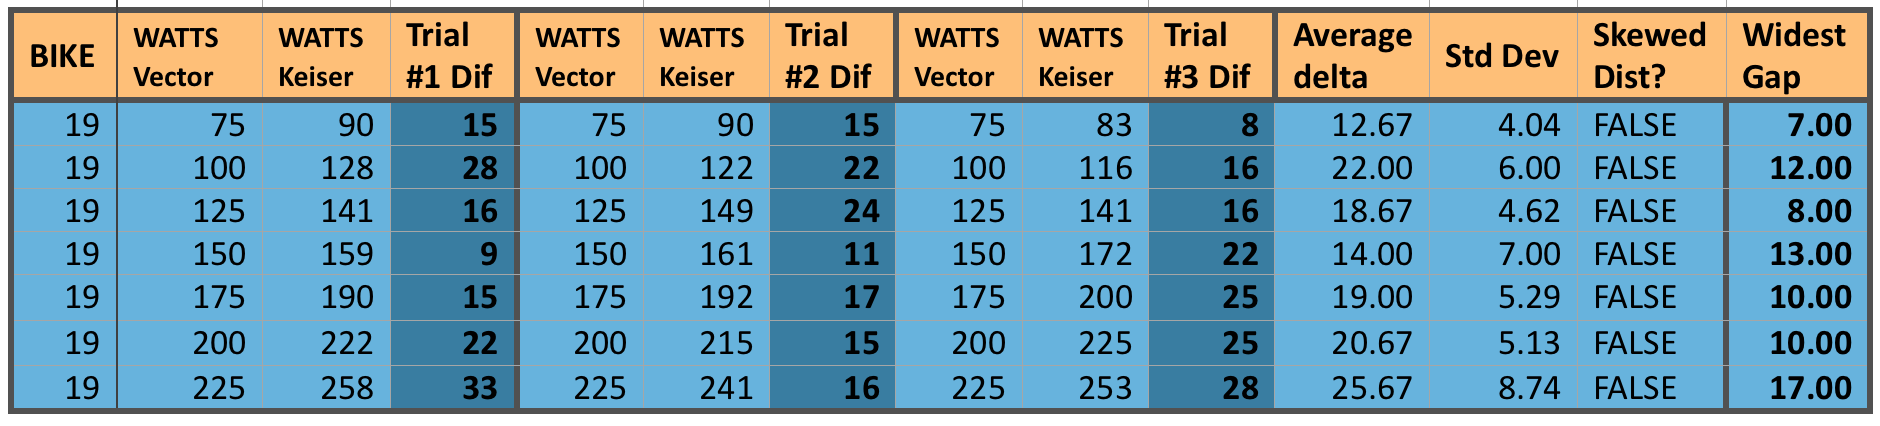
Bike 19 tested 3 separate times, looking for consistency between tests, for reliability to set bike handicaps.
Our last bike does seem to show a glimmer of hope though. While this specific bike had some of the largest differences in actual to measure power differences (in the 15 to 25 watt range), at least it showed those big swings fairly consistently. Notice how small the Standard Deviation is compared to the average delta (simply means the difference) among all three trials. This thus demonstrates a more “normal” distribution and could indeed support a type of “Power Handicap”.
So perhaps I have saved the good news for last. Maybe… just maybe, this means that some bikes would be amenable to a type of handicap while others may not. Picking up on Sarah’s suggestion, a lot more research (translate that — time spent repeating tests on the same bikes, many bikes) might lead to a set of bikes that are “good to go” with a handicap, and a set that are not. Naturally, being the proverbial curious cat, I would want to find out if there is some reason the unreliable bikes are that way. We might even be able to take those bikes through a preventive maintenance routine, recalibrate them to the furthest extent, and repeat the same retests. If we come up with a majority of the bikes being statistically solid and reliable, then we have not only created a handicap system, but we’ve validated the calibration method.
However, having spent as many hours as I have so far on this project, I’ve hung my lab coat up for now, so you won’t be blinded by science from me or a while. If I were Keiser corporation though, I believe I would have a vested interest in picking up where this research left off. I have moved this conundrum past the “blank page” and created a possible path that they could very well negotiate to a workable solution for their clients. Perhaps many clients don't care. I get that – not everyone even uses the training tools. Yet they were bold enough to lead the industry with power and have played a major role in seeing this industry change for the good. I believe Joe Public is becoming increasingly more savvy when it comes to training, and this is rapidly becoming a more educated marketplace. Especially if they consider just their own clients, such an undertaking should be received very well, supporting their image as a company that takes training seriously enough to put in the time and energy to make it right.