
by Gino | Aug 30, 2019 | Master Instructor Blog, Training With Power

It’s finally time to take a look inside.
First I have to apologize for taking almost 2 months to report on results that were secured after just 4 weeks of data collection. That’s part of the problem with Evidence Based Cycling; once you do herd all those cats on bikes (see last post) and send them on their way to collect data, you have to eventually herd them over again to retrieve the data. I only got the final piece of performance data last week.
I won’t hold you in suspense any longer, the results appear below in summary form — with the bottom line of: “What effect if any did this protocol or riding drill have?“ or perhaps more simply stated “Did we get an better?” or better yet, would it be more appropriately states as “can this protocol be used as a specific prescription for improving Muscular Endurance in cyclists?” Frankly, I want to know that for myself and my own riding, as much as I want to or need to know it for the riders I coach personally.
Summary Results
The summary results shown here simply compared the Baseline Test (our method for determining their power generation and sustainability levels at the start of the test) to their Performance Test that sought to measure the same thing, on the same bike, in the same manner. The results seem to suggest that this riding drill for improving Muscular Endurance works.
|
SUMMARY RESULTS
|
Muscular Improvement
|
Endurance Improvement
|
Efficiency Improvement
|
|
Average Change:
|
5.03%
|
3.35%
|
17.29%
|
|
Throwing out High & Low:
|
5.04%
|
5.04%
|
13.90%
|
The one fact that can, and often does bring seemingly good findings into question is the sample size. While we started with 11, we ended up with only 8 riders who completed the study. There are a variety of reasons for this, none of which had anything to do with the test itself. In any event, to be considered valid by almost any rigorous standard, this type of study would have to be repeated with a bigger sample size. May this preliminary “investigative type research” would inspire some budding graduate student in the physiological sciences to pursue a wider study.
Are The Results Statistically Significant?
In terms of whether we can consider these results meaningful or not, we must first introduce the term or phrase associated with this question; “statistical significance”. In regards to research findings, it has a fairly specific definition. Wikipedia explains it this way: “Statistical significance” is a statistical assessment of whether observations reflect a pattern rather than just chance…” It further defines the level or degree of significance this way: “The choice of significance level is somewhat arbitrary, but for many applications, a level of 5% is chosen by convention.[3][4]”
As you can see from the summary results, by all accounts calculated, only the Average Change in Endurance would come into question. This is quite understandable given the fact that these results were assessed only 4 weeks after the study began. In training other athletes, and in training myself as a semi-retired racer, I can tell you that most real and lasting training effects take 6 weeks to be “established”; established as in the gains are likely to not be reversed any time soon, and that there was a real cause and effect relationship between the work and the result.
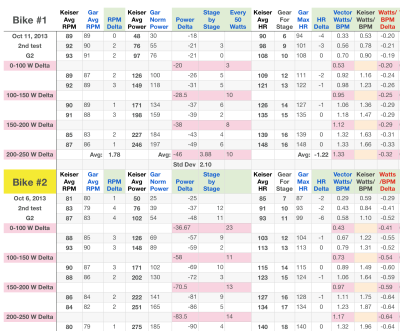
The Gory Detail
Below is the table with all the numbers that make up the summary findings above. Data geeks control yourself — these numbers only represent 4 weeks of following the M.E. protocol, and we need much more data to begin to think of implications beyond the obvious conclusions drawn from what we see here. That will be the focus on our next blog post — what all can we see and say about this data and its implications for both training and further research.

Click image to enlarge
Stigler S (2008). “Fisher and the 5% level”. Chance 21 (4): 12. doi:10.1007/s00144-008-0033-3.
Fisher RA (1925). Statistical Methods for Research Workers (first ed.). Edinburgh: Oliver & Boyd.
Originally posted 2012-10-24 11:49:24.
by Gino | Mar 4, 2019 | Training With Power

What's Your Experiences With Power?
In a previous post we talked specifically about the reasons why “non-outdoor riders” would want to train with power. There needs to be incentive for all populations, and thus our focus on those that don’t ride outside was appropriate as a starting point. However, we can’t forget about how powerful (pun intended) this training is for those of us who do ride outside.
Whether it is mountain biking, road cycling, or even touring, power can be the gateway to a new experience on two wheels. You’ll be able to “hang with the faster group”, climb the hills you used to walk, or climb with speed where you used to get dropped, or just feel fresh throughout a touring ride while your companions are “suffering”.
Let’s define power just a little more precisely. It is not simply the amount of “work” you are doing. That is a different measurement. Sure many people say “I worked hard today in class”. You are also admonished by instructors to “Work it!”. In fact, the entire industry uses the term “work out” to refer to exercise. However, when it comes to Power, in terms of work, it is the RATE of performing that work; how fast you do it.
The easiest example is walking up a set of steps. If you walk up the steps, or run up the steps, it’s the same amount of work. However, running will require a different amount of power. To perform the same work faster, requires more Power. Hence, to make a bike go faster, you need more power. The same concept applies to climbing. The same hill will require the same “work” for a given individual, but if they climb it faster, it will require more power.
(more…)
by Gino | Nov 20, 2018 | Training With Power
 Watt Is Power? Or rather what is power?
With a title like that, we could be here for days. Perhaps a better title would have been: What Is Power As It Relates To Cycling or even more to the point would be: Training on Indoor Cycling or Spinning® Bikes With Power. But as you see, that would have been quite a long and clunky title. So I spared you. Naturally, we will be confining our discussion to how the dynamics and science of Power has been applied to the sport of cycling. More specifically how it relates to the world of Indoor Cycling or Spinning® and the equipment used for this in most fitness facilities; stationary bikes. While most of our work was done on the Keiser M3 indoor bike, we are currently in the process of acquiring other power bikes for continued independent research.
Definition
Power is the product of strength and speed or put in terms of indoor cycling, the resistance applied to the fly wheel, and the RPM or cadence of pedaling. That seems pretty easy to understand right. The equation that comes to mind is:
Power = Resistance X Cadence
Oh if it were only this simple. Well, for the purposes of Indoor Cycling or Spinning®, this is all we need to know, and thuse, we have made it that simple. However, if you ride outside, you need to know that there are quite a few factors that also impact power as it relates to cycling. While we enjoy the perfection of a controlled environment for training, riding outside is anything but a perfect and consistent. Consequently, there are lots of factors that can affect one’s power. A bunch of very smart people from Penn State put together a nifty Power Calculator for those of you who are even bigger data geeks than myself. You can find it at: http://www.me.psu.edu/lamancusa/ProdDiss/Bicycle/bikecalc1.htm
Here is a sneak peak at all the factors that go into calculating power when we move outside:

As you can see form the screen shot above, at least 65 thousand other people have a similar curiosity about power. You can also find a kazillion references to power as it relates to cycling on the internet, but our discussions will be squarely focused on how power is measured and used for Indoor Cycling or Spinning®.
This does not mean that the power generated indoors is not the same as the power generated outdoors. Essentially they are the same. It simply means there are different methods used to measure that power due to differences in equipment, environment and cost. Yes, there will be differences in the Watts you generate indoors, and what your power meter measures outdoors. Even cyclists who use the exact same bike, with the exact same power meters indoors and out will experience differences. Shocking as it may seem, the most expensive equipment available will still produce variations due to the enormous influence environment has on the rider and the equipment.
Nevertheless, this does not take away the value of training with power. Power meters still represents one of the best tools for improving your general fitness and/or performance on a bike that has hit the Indoor Cycling or Spinning® market in a very long time. The differences between indoors and out will not negate these positive effects. At the end of the day, it’s the results we are looking for, and training with power will surely deliver!
Read more of Gino's Training with Power Articles – Here

by Gino | Dec 11, 2017 | Instructor Training, Master Instructor Blog, Training With Power

Coach Gino walks us through data collection
The first two video blogs showed the detailed process of performing power tests on the Keiser m3 bike with Garmin Vector power pedals mounted on them so that the power shown on the Keiser m3 can be compared to the power being measured by the Vector pedals. As you know, the m3 displays power based on a calculation or table within the computer that is a function of the magnet’s position with respect to the flywheel and the speed of your pedaling (cadence or RPM).
The standard approach considered most accurate and reliable in the industry is to measure the power where it is applied — somewhere between the feet moving those pedals, and the axel of the wheel being propelled forward by the pedaling motion. Power meters can now be found in any number of places along that continuum; from the pedals to the crank arms to the bike’s bottom bracket and the most widely used place of all – in the hub of the rear wheel. These power meters contain strain gauges that literally are sensing the torque or force being applied as you pedal.
It is these power readings that are then recorded on the Garmin 500 bike computer that I paired to the Vector power pedals to get a true reading of power being exerted during each pedal stroke. In fact, there are strain gauges in each pedal so that it also reports on the differences in power generated from each pedal; left and right. So we now can know what the real power numbers are as we work out on the Keiser m3.
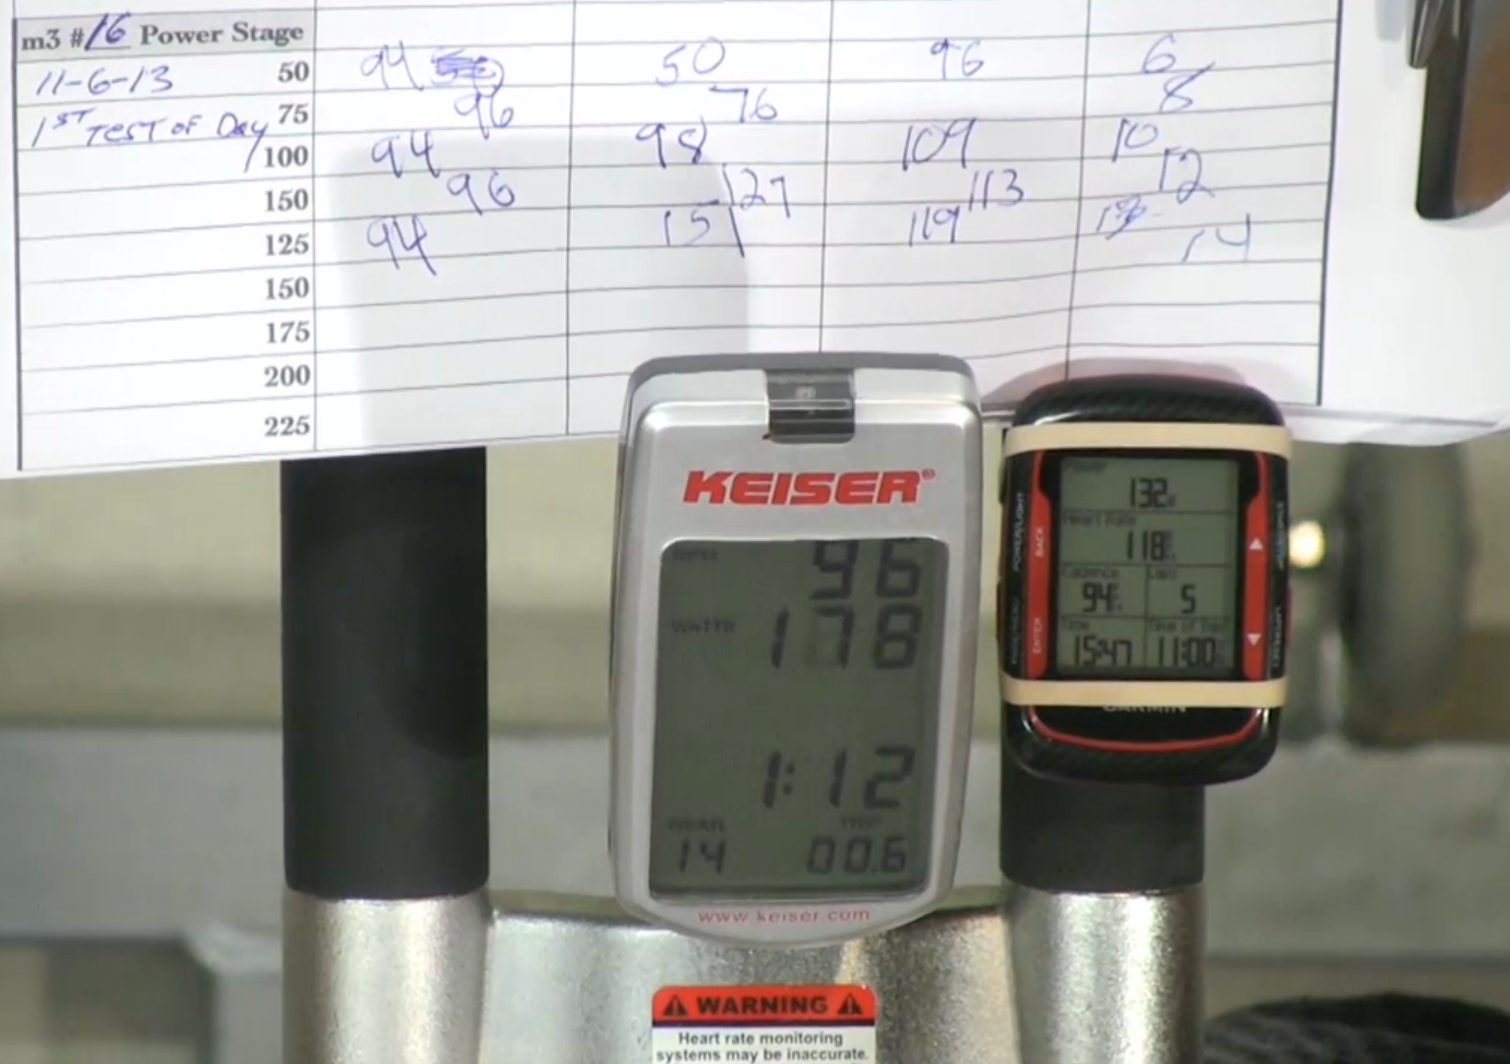
This is the 3rd video in the series that shows the exact process I underwent to take the data generated (from both the Keiser bike and the Vector pedals ) during these tests and record them. The recording of data included both graphic snapshots as well as detailed numeric data from both the Garmin and the hand written readings taken during the actual test (since the Keiser offers no way to retrieve the data from their computer). These were all then copied into a single spreadsheet for comparison and analysis.
Spreadsheet shows both Keiser display and Garmin Vecor #s
I warn you, if you are not a data geek, and are not experienced in the unique joys of number crunching, this video may not be safe for you. Make sure to have soft surroundings as you watch this video. Without the proper training and experience, you may find yourself falling asleep at an alarmingly fast rate. Viewer beware! Click the link below if you dare… I mean to watch the video. ☺
Watch the 3rd video blog.
http://vimeo.com/78927160
Indoor Cycling Power Accuracy & Validation Research from Cycling Fusion on Vimeo.
Originally posted 2014-01-29 17:21:10.
by Gino | Dec 7, 2017 | Instructor Training, Master Instructor Blog, Training With Power
Data Collection for the Power Accuracy Research project
On the last blog post (8/11/17) v we spent a considerable amount of time showing how we set up the test, the equipment, calibrating the power pedals for each trial, positioning all of our data collection tools, and just preparing each test in a methodical manner. This post picks up where we left off and is the only video blog showing the entire test performed on the Keiser m3 with the Vector Power Pedals. This was done so that the reader can see the precise protocol used for all of the trials for all of the different bikes and the repeats with the same bikes.
I only recorded one full session (out of the 25 to 30 total that I performed) as a “reference” session so that the full and complete protocol can be understood and seen. You can even follow along with your own bike if you want to ride while you watch this video.
The most interesting thing to note is that you can see the power clearly as the test progresses between the Keiser and the read out on the Garmin. The variance is significant.
Watch the 2nd video blog.
http://vimeo.com/78919570
Indoor Cycling Power Accuracy Research from Cycling Fusion on Vimeo.


