
by Gino | Nov 18, 2019 | Instructor Training, Master Instructor Blog

* n'at a “general extender”[2][3] (http://en.wikipedia.org/wiki/Pittsburgh_English)
For those of you not well versed in the language of “Pittsburghese”, we use the phrase “n’at” for a variety of reasons, but in this case it means “along with some other stuff”. Consider this a “side-bar” to the story I’ve been building in this Evidence Based Cycling blog. John Macgowan wrote an article on incorporating the “grade of a climb” into your Indoor Cycling classes, and it seemed like a great topic to write a follow up for.
Power, Speed & Grade of the Hill
While writing the first book on Training with Power for the Indoor Cycling environment, it became imperative to create a system that was both practical and easy to teach from Indoors, but that could also be directly applicable outdoors. After all, the mission of Cycling Fusion™ from day 1 has been to bring these two worlds together, and the validation of how our training translates while riding on 2 wheels continues to be a Start Trek level “Prime Directive”.
To that end, my crew and I followed the same approach I have been describing each week through this blog. . So, I purchased an outdoor power meter (the iBike was the cheapest that had about a 5% tolerance for accuracy — plenty for our application. Getting 100% accuracy is absolutely necessary indoors, since we won’t have the same power gauges outside anyway, and we just need to know that we are improving it, not that we are at 200 or 300 or 225 or some other arbitrary power number.
When I would ride outside, I would compare the wattage I was seeing indoors with wattage figures while riding outdoors. This led to a variety of research undertakings with myself and my study participants. This work on Power truly marked the beginning of Evidence Based Cycling, I just had not put a name and more structure to it at that time.
1 Watt per Pound
One of the key principles presented in the book is the notion that if we want to ride outside, or more specifically, if we want to be able to climb typical hills that cyclists normally climb outside, we need to be able to achieve a minimum of about 1 Watt per pound of weight you are carrying up the mountain (rider wt + bike wt).
Through existing math equations, we were able to create a chart that showed how many Watts/lb would be required on hills with specific grades, given specific speeds. It turns out that under 1 Watt/lb there are few hills that can be ridden at a speed of 5 MPH or greater. Below 5 MPH it becomes increasingly hard to hold the bike upright. One can just about walk at 4mph, and that’s not “speed walking”.
Willing Guinea Pigs… er Volunteers
I was lucky enough to have a bunch of regular members that embraced the whole EBC approach to training and learning, and they were more than willing to help with the research. We first wanted to know if the chart and our math seemed to bear itself out in the real world. We used different people, at different riding and fitness levels to climb various hills with differing grades with our power meter, and we found that the numbers seemed to jive. While the testing of our own clients and fellow coaches/instructors would have been enough for us to build our training with, in writing a book for “the masses” we were compelled to go a bit further.
We wanted to establish some early credibility with both the book and our own research, so we commissioned a University Study to validate the formula and the chart in a different state with different riders, and with a Power Tap that would directly measure power instead of our inexpensive model that only calculated it.
Independent Validation
Carl Foster, Ph.D., FACSM; is the director of the Performance Lab at the University of Wisconsin. His team independently validated the chart that our 1 Watt/Lb principle is based upon, and thus we have a solid foundation for using this as a good target Power goal for the average rider. Here are the final excerpts from their published paper:
Results: Predicted PO and measured PO (within the range of 140-400W) were highly related (r=0.989), with an essentially zero value for intercept (Figure).
Conclusions: Without correction for wind, altitude or the effect of additional riders, the relationship between predicted and measured PO during cycling was very strong, supporting the value of published climb equations.
Comparison of Predicted and Measured Power Output During Uphill Cycling
Carl Foster, Ph.D., FACSM; Jacob Cohen, Gene Nacey University of Wisconsin-La Crosse and Cycling Fusions.

Comparison of Predicted and Measured Power Output During Uphill Cycling Carl Foster, Ph.D., FACSM; Jacob Cohen, Gene Nacey University of Wisconsin-La Crosse and Cycling Fusions.
Implications for Indoor Cycling Instructors
Given that there are no real hills and real grades in an indoor cycling room, one must artificially create the feeling by adding resistance. With the spate of power indoor cycles there are now on the market, using the Speed & Power Chart, and specifically 1 Watts/Lb as a target, and the concept of Watts/Lb as a training parameter can provide a ton of useful options for cueing climbs or even entire classes.
Originally posted 2012-06-14 05:42:48.
by Gino | Oct 23, 2019 | Keiser Cycling, Training With Power
 –
–
My original objective of the Power blog here in ICI/PRO was to build the case for power precept upon precept, slowly but surely. Good idea, except for folks who already find themselves teaching on power bikes and are anxious to get to the meat & potatoes. So, as the line in Monty Python’s Holy Grail said (whilst preparing to throw the Holy Hand Grenade) “Skip ahead brother…”
The most fundamental principal in power training is that you can sustain higher power output for shorter periods. This is common sense of course, but when trying to train or “hone in” on power levels you will use for different types of riding outside, one needs to identify these time periods, and develop power based on the length of those efforts.
For example, outside of the long mountain passes in Colorado, or Europe, your standard “hill climb” will often be only 3 to 5 minutes. This is also met with generally a steeper grade than those more gradual, longer climbs, and thus there is a measure of power required to climb those that is significantly higher, and requires different training.
In addition, if you race (or simply want to just impress your friends at every opportunity), you may want to develop significant sprinting or break away skills. To do that, you will want power that is even higher than climbing power, but may only be needed for as little as 60 seconds. This may seem quite short, but it is often all that is needed to achieve a real break away, or triumph in a race ending sprint.
Consequently, we have built the Cycling Fusion Power Training system on 3 zones of power; Sustainable Power (7 to 20 minute efforts), Climbing Power (3 to 6 minute efforts) and Explosive Power (1 to 2 minute efforts). These ranges are quite large, and there are 7 power levels within each zone. Rather than bore you with all the details, let’s just jump in and conduct a class that provides a sample of each of these zones.
The class design below is based on the Keiser M3 bike, since it is what we use at my club (Global Ride Training Center) in Pittsburgh. Since we also speak specifically to how we can reset our power numbers, I’ve written this class specifically to this model, and thus I call the class: The Keiser Tour De Power. For those that do not have a Keiser M3, but do have power, simply replace the portion of this workout that speaks to resetting the bike to get your average power numbers for one of the zones, and it will work just as well on any other bike.
Download the PROfile here.
Please post any comments or questions here, and I’ll do my best to answer them all.
Originally posted 2010-02-10 05:22:00.
by John | Oct 3, 2019 | Instructor Tips and Tricks, Instructor Training, Training With Power

How steep is a 4% grade? 8%? Over 10%?
How do I effectively explain % of grade to my class?
What are the feelings I would experience climbing different % grades on a bicycle?
And finally, how do I effectively communicate that feeling to my class?
Every July we hear commentators Phil Liggett, Paul Sherwin and Bob Roll discuss how the Tour de France is won or lost in the mountains. Just winning one of the popular climbs; Alpe d'Huez, Mont Ventoux, Col du Tourmalet or others can be the highlight of any cyclists career. But when Liggett explains that Alpe d'Huez has an average grade of 8% what exactly does that mean? Based on context, we can assume that this is a very difficult climb… but how difficult? What does it feel like to ride with the professional Peloton as everyone powers up a long climb at 8% grade?
So with the Tour only a month away and many Instructors and students riding outdoors, I felt you might benefit from some cliff notes on Grade and Slope. If you are reading this outside of North America, the concepts that I'm going to present are the same, but how they are noted on street signs varies from country to country.
Simply put, % Grade is gain in elevation (what's called the Rise), over a horizontal distance (the Run) – “typically” 100 feet or meters. The actual distance traveled is the Slope length which is slightly longer than the Run – it's that A²+B²=C² Pythagorean theorem thing you grew to love in highschool 🙂
So…
A 5% grade = a 5′ increase in elevation in 100′ of horizontal travel.

Image from Wikipedia
So you don't confuse the engineer's in your class, be careful not to mix up % of grade and the degrees of angle. They're completely different and roads aren't measured in °. If you feel it would be helpful to your students, you may want to comment that a road at 45° (as if that would be possible) would have a 100% grade, i.e. 100′ forward @ 100′ up.
Wikipedia has an informative page on Grade / Slope if you'd like to learn more.
Alpe d'Huez has an average grade of 8.1% over a run of about 13 km. Click to see the profile. That sounds impressive but it really tells you nothing if you don't understand what it feels like to ride a bicycle up an 8.1% grade. Actually 8.1% is the average. The first kilometer and a half are at over 10%.
If you want to clearly communicate the pain of climbing a 8.1% my suggestion is to find a steep hill, ride up it and experience what it feels like.
So now you may be thinking; “great idea John… but I don't recall seeing the grades marked any of the roads in my neighborhood.” My response would be; go out, find one and measure it.
I made the video below for a different project where I recommend that cycling studios measure and mark the road as a helpful guide to outdoor cyclists. In the video I describe the simple process of measuring the grade of one of the local climbs in your town.
If that went by to quickly, you divide the number of vertical inches by 120 (10′) which gives you the % grade.
How I communicate % grade in my classes.
Discussions of % grade typically come up when I'm teaching a virtual ride using an Epic Planet DVD or Global Ride's Dirty Dozen DVD, the grade of each climb is listed in the information bar at the bottom of the screen and I'll use it to help explain the intensity of each effort. I start by explaining that, although it doesn't sound like much, 4% is a serious climb that will have most of us at Threshold HR or Power FTP if it's of any length. I go on to explain that (at least where I live) most roads or highways rarely exceed 4%.
I'll reference local roads, that I understand the % grade, to my class – my apologies to those of you in flat lands of Iowa or Florida, you're on your own. Some of these roads, on established cycling routes, have steeper grades that I have measured. I'll talk about them by name; “Fox Road Turn” 8%, “Carver Wall” 12% and “Eden Prairie Road” 13.5% as a way to appeal to my cyclists who have experienced these climbs for real.
Other examples:
- 5% has you in your small chain ring (the sprocket in the front) and you need to manage (limit) your effort so as not to blow up!
- 8% and you're wishing you had a smaller gear and it's everything you can do to ride in a straight line. It's also everything you can do keep your pedal stroke smooth. Time here is short with your HR way over VT2 – Threshold.
- 10% is the limit of most recreational cyclists, if the climb is longer than a block or two. Smallest gear, out of the saddle and HR is as close to maximum as you can tolerate.
- 15% or more and you get off and walk 🙁
Once you've measured and ridden a climb with known grade, my guess is you're going to have a new appreciation for how truly difficult those famous climbs in the Tour de France really are and a new respect for the professional cyclists who climb them.
You can find the profiles of every climb, in every major Tour, along with 33,773 others at http://www.climbbybike.com/
Do you have any tough climbs near you?
Originally posted 2012-06-06 11:45:22.
by Gino | Aug 30, 2019 | Master Instructor Blog, Training With Power

It’s finally time to take a look inside.
First I have to apologize for taking almost 2 months to report on results that were secured after just 4 weeks of data collection. That’s part of the problem with Evidence Based Cycling; once you do herd all those cats on bikes (see last post) and send them on their way to collect data, you have to eventually herd them over again to retrieve the data. I only got the final piece of performance data last week.
I won’t hold you in suspense any longer, the results appear below in summary form — with the bottom line of: “What effect if any did this protocol or riding drill have?“ or perhaps more simply stated “Did we get an better?” or better yet, would it be more appropriately states as “can this protocol be used as a specific prescription for improving Muscular Endurance in cyclists?” Frankly, I want to know that for myself and my own riding, as much as I want to or need to know it for the riders I coach personally.
Summary Results
The summary results shown here simply compared the Baseline Test (our method for determining their power generation and sustainability levels at the start of the test) to their Performance Test that sought to measure the same thing, on the same bike, in the same manner. The results seem to suggest that this riding drill for improving Muscular Endurance works.
|
SUMMARY RESULTS
|
Muscular Improvement
|
Endurance Improvement
|
Efficiency Improvement
|
|
Average Change:
|
5.03%
|
3.35%
|
17.29%
|
|
Throwing out High & Low:
|
5.04%
|
5.04%
|
13.90%
|
The one fact that can, and often does bring seemingly good findings into question is the sample size. While we started with 11, we ended up with only 8 riders who completed the study. There are a variety of reasons for this, none of which had anything to do with the test itself. In any event, to be considered valid by almost any rigorous standard, this type of study would have to be repeated with a bigger sample size. May this preliminary “investigative type research” would inspire some budding graduate student in the physiological sciences to pursue a wider study.
Are The Results Statistically Significant?
In terms of whether we can consider these results meaningful or not, we must first introduce the term or phrase associated with this question; “statistical significance”. In regards to research findings, it has a fairly specific definition. Wikipedia explains it this way: “Statistical significance” is a statistical assessment of whether observations reflect a pattern rather than just chance…” It further defines the level or degree of significance this way: “The choice of significance level is somewhat arbitrary, but for many applications, a level of 5% is chosen by convention.[3][4]”
As you can see from the summary results, by all accounts calculated, only the Average Change in Endurance would come into question. This is quite understandable given the fact that these results were assessed only 4 weeks after the study began. In training other athletes, and in training myself as a semi-retired racer, I can tell you that most real and lasting training effects take 6 weeks to be “established”; established as in the gains are likely to not be reversed any time soon, and that there was a real cause and effect relationship between the work and the result.
The Gory Detail
Below is the table with all the numbers that make up the summary findings above. Data geeks control yourself — these numbers only represent 4 weeks of following the M.E. protocol, and we need much more data to begin to think of implications beyond the obvious conclusions drawn from what we see here. That will be the focus on our next blog post — what all can we see and say about this data and its implications for both training and further research.

Click image to enlarge
Stigler S (2008). “Fisher and the 5% level”. Chance 21 (4): 12. doi:10.1007/s00144-008-0033-3.
Fisher RA (1925). Statistical Methods for Research Workers (first ed.). Edinburgh: Oliver & Boyd.
Originally posted 2012-10-24 11:49:24.
by Joey Stabile | Feb 19, 2019 | Health and Wellness, Instructor Tech Help, Instructor Training, Off Season - Winter Training, Strength Training
Exercises to Boost Hip Strength
When discussing muscles involved in the pedaling motion of cycling, most people think of quadriceps and hamstrings. While these muscles certainly play an important role, the many muscles of the hip also deserve attention, and the weight room is the perfect place to keep them functioning properly.
Before discussing different strength and mobility exercises, we should first look at activation exercises for your Gluteus Maximus (referred to as the glutes) muscles. The reason for needing to activate your glutes is simple–as a population, we spend way too much time sitting, and as a result, what happens is what noted spinal researcher Stuart McGill terms gluteal amnesia–your glute muscles can “go to sleep” and not function properly.
When your glutes aren't functioning properly, other muscles (hamstrings and lumbar extensors) are called in to do the job of the glutes, mainly hip extension. Think of hip extension as the downward action of pedaling.
The problem is that these muscles aren't designed to be prime movers–they're designed to support the action of the glutes. Inability of activating the glutes can result in low back pain (low back muscles compensating), hamstring strains (overacting hamstrings), hip pain (resulting from hamstring-dominant hip extension) and knee pain (poor glute medius strength).
So, to activate your glutes, try the Single-Leg Hip Lift. Here's how it's done: Lie down on the floor with your legs bent and lift one foot off the floor. Lift your hips up in the air, concentrating on contracting your glute muscles. Make sure you keep your toes of the working leg up as shown. Pause for a second or two and lower. Perform 2 to 3 sets of 8 to 12 reps on each side.
Hip Mobility: Keeping your hips mobile is important for overall hip function and athletic performance. Mobility refers to the ability of your joints to move through a pain-free, unrestricted range of motion. For cyclists, hip mobility is critical since pedaling occurs in one plane of motion, and after miles and miles in the saddle, hip tightness and restriction may develop. The following movements will help with hip mobility.
Split Squat: The traditional split squat is a great exercise to get started on hip mobility. To make this exercise even better, concentrate on contracting your glute on the trailing leg to help stretch your hip flexor.
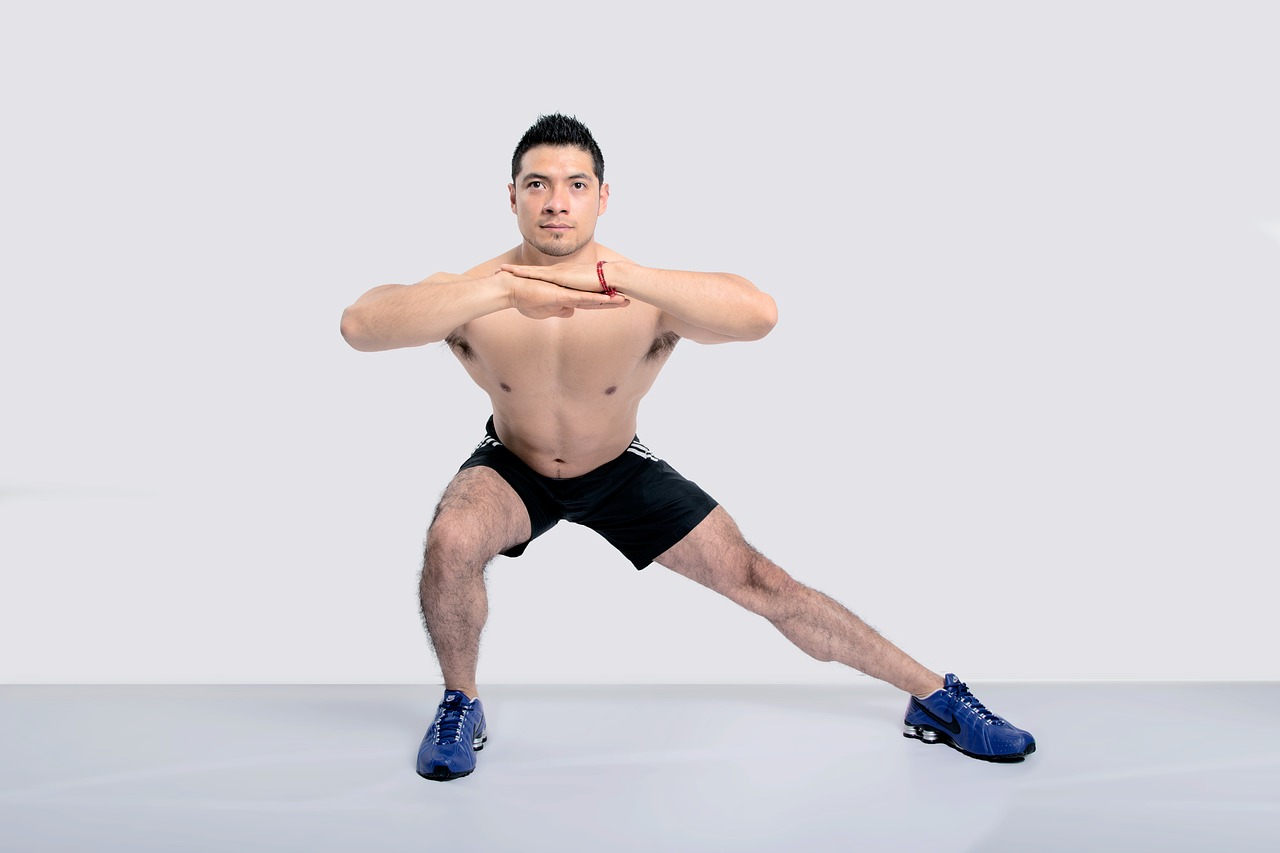
Lateral Squat: Stand with your feet approximately double shoulder-width apart. Shift your weight to one side and drop your hips down and back, keeping your knee over your toes and your weight over your bent leg. Pause for a 2-count, return to the starting position and repeat to the other side.
Hip Strength: If you are currently doing a regular strength-training program, chances are you're already doing some foundation exercises for your hips. Squats, lunges, leg presses, and step-ups all work the prime movers of your hips. Along with these exercises, it's also important to do some supplementary exercises to work your hip's supporting muscles. you've probably heard of your shoulder's rotator cuff. Well, your hip also has a cuff, or a group of muscles that help stabilize and support movement. For these exercises, you'll need a mini-band, a longer thera-band or tubing (both are sold at many sporting goods stores, or can be purchased online), and a cable-column unit.
4-Way Mini-Band: Place a mini band around your ankles and spread your feet about shoulder-width apart. Keeping your legs relatively straight (you want the motion to come from your hips) and toes pointing forward, walk forward 10 steps, then backward 10 steps. Take a short break and then walk to the right 10 steps, then to the left 10 steps. Again, focus on keeping your legs straight and toes pointing forward. It is very important to start with a light-resistance band. You'll be working the smaller hip stabilizers, so you don't need a lot or resistance.
X-Band Walk: For this one, you'll need a large band or piece of tubing. Step on the band and spread your feet shoulder-width apart. Form an “X” in front of you with the band and stand up tall with your shoulders down and back. Keeping your toes pointing forward, take 10 steps to the right, pause and then return.
4-Way Cable Hip: You'll need a resistance band for this one. With this exercise you're focusing on four movements: flexion, extension, abduction and adduction. Stand up straight while doing the exercise. If you have to lean excessively, step closer to the anchor point of your band to decrease resistance. You'll find that not only are you working the muscles of the leg that's moving, the muscles of your stance leg will work quite hard stabilizing and balancing.
Modifications to Traditional Exercises: Our hip joints are very mobile and allow for movement in three planes of motion: the sagittal plane (flexion and extension), frontal plane (lateral movements), and the transverse plane (rotation). Knowing that, here are several modifications you can make to your traditional exercises to work your hips through a more complete range of motion.
Lunge Variations: You can do traditional lunges, or even clock lunges where you keep one leg stationary for 12 to 6 and then the other leg stationary for 6 to 12. To make the movement a touch more difficult, hold weights in your hands while you perform the exercises. There are Lateral Lunges, Rotational Lunges, Lateral Step-Up, and Rotational Step-Up as well.
Please see the full article for complete descriptions and videos of the exercises: https://www.active.com/cycling/articles/11-exercises-to-boost-hip-strength?cmp=18N-PB2000-S20-T9-cycling-AR2&eps=title_1004667
